中国国家概况信息图
一份详细的 16:9 国家概况信息图,包含中国 3D 地形浮雕地图,以及经济、人口、出口和贸易统计数据。
- Category
- Charts & Infographics
- Model
- GPT Image 2
- Creator
- Abkr Sadiq
- Source language
- en
- Source ID
- 20253
- Published
- May 14, 2026
Full prompt
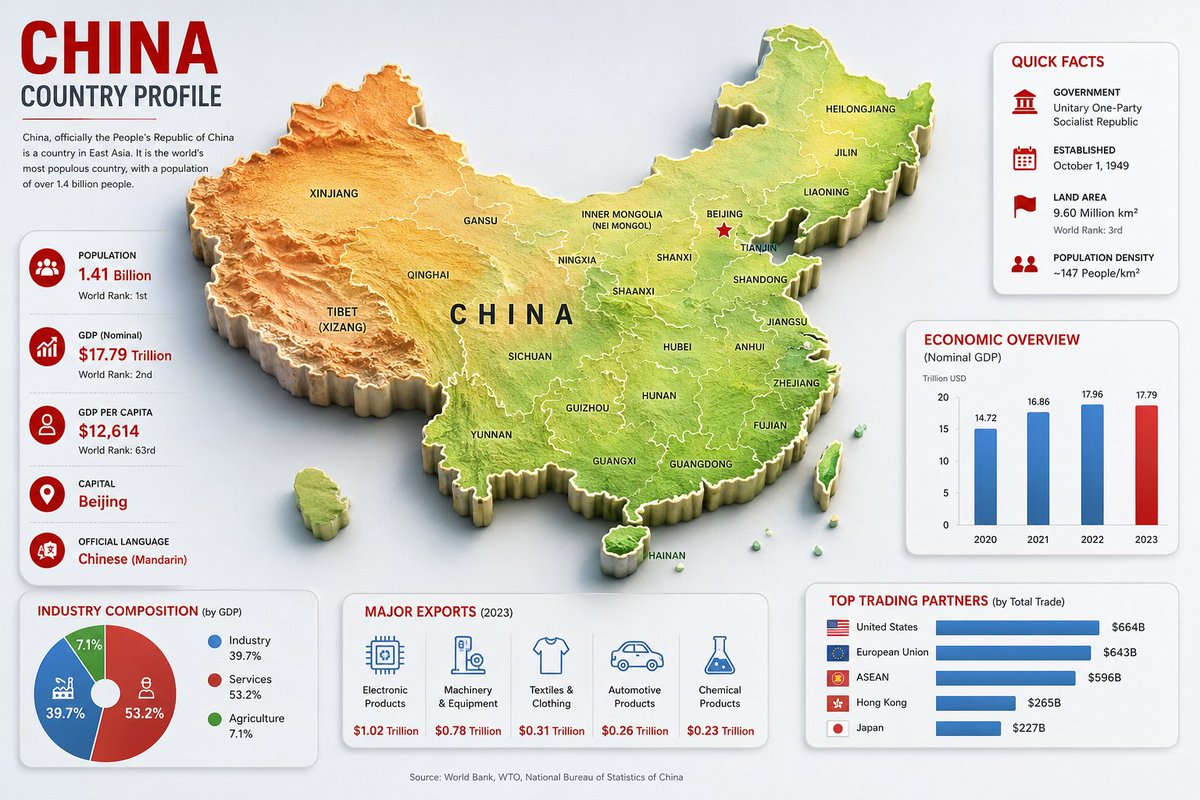
Goal: Create a clean, modern country-profile infographic for {argument name="country name" default="China"}, titled “CHINA COUNTRY PROFILE,” with a large central 3D raised relief map and surrounding statistical cards.

Canvas: 16:9 horizontal infographic, light gray background, crisp corporate editorial style, subtle shadows, red/blue/green accent colors, high-resolution vector-meets-3D look.

Main map: Place a large raised 3D topographic map of China in the center, occupying most of the canvas. Use terrain coloring: orange-brown mountains in the west, yellow central plateau, green eastern lowlands and coast. Add white province borders and black province labels. Include Taiwan, Hainan, and small South China Sea islands as separate raised pieces. Put large spaced black letters “CHINA” across the center. Mark Beijing with a red star and label it. Visible map labels should include exactly 28 province/region/city labels: Xinjiang, Tibet (Xizang), Qinghai, Gansu, Inner Mongolia (Nei Mongol), Ningxia, Sichuan, Yunnan, Guizhou, Guangxi, Guangdong, Hainan, Fujian, Zhejiang, Jiangsu, Anhui, Shandong, Hubei, Hunan, Shaanxi, Shanxi, Beijing, Tianjin, Liaoning, Jilin, Heilongjiang, Taiwan, and China.

Top-left title block: Big red headline “CHINA,” dark subtitle “COUNTRY PROFILE,” a thin red divider line, and a short paragraph: “China, officially the People’s Republic of China is a country in East Asia. It is the world’s most populous country, with a population of over 1.4 billion people.”

Left statistics card: A tall rounded white card with exactly 5 stacked fact rows, each with a red circular icon and text. The 5 rows are: Population — {argument name="population value" default="1.41 Billion"} — World Rank: 1st; GDP (Nominal) — $17.79 Trillion — World Rank: 2nd; GDP Per Capita — $12,614 — World Rank: 63rd; Capital — {argument name="capital city" default="Beijing"}; Official Language — {argument name="official language" default="Chinese (Mandarin)"}. Use thin separators between rows.

Top-right quick facts card: A rounded white card titled “QUICK FACTS” in red. Include exactly 4 rows with red icons: Government — Unitary One-Party Socialist Republic; Established — October 1, 1949; Land Area — 9.60 Million km², World Rank: 3rd; Population Density — ~147 People/km².

Middle-right economic chart card: A rounded white card titled “ECONOMIC OVERVIEW” with subtitle “(Nominal GDP)” and small label “Trillion USD.” Include exactly 4 vertical bars for 2020, 2021, 2022, 2023 with values 14.72, 16.86, 17.96, 17.79. Use blue bars for 2020–2022 and a red bar for 2023.

Bottom-left industry card: A rounded white card titled “INDUSTRY COMPOSITION (by GDP).” Include exactly 3-part donut chart segments: Industry 39.7% in blue, Services 53.2% in red, Agriculture 7.1% in green. Add matching legend with the same 3 labels and percentages.

Bottom-center exports card: A rounded white card titled “MAJOR EXPORTS (2023).” Include exactly 5 export columns with blue line icons and red values: Electronic Products — $1.02 Trillion; Machinery & Equipment — $0.78 Trillion; Textiles & Clothing — $0.31 Trillion; Automotive Products — $0.26 Trillion; Chemical Products — $0.23 Trillion.

Bottom-right trading partners card: A rounded white card titled “TOP TRADING PARTNERS (by Total Trade).” Include exactly 5 horizontal blue bars with small flag icons and values: United States — $664B; European Union — $643B; ASEAN — $596B; Hong Kong — $265B; Japan — $227B.

Footer: Center a small source line reading “Source: World Bank, WTO, National Bureau of Statistics of China.”

Constraints: Keep all cards aligned around the map without overlapping it, use consistent typography, red headings, blue chart elements, subtle drop shadows, rounded card corners, and no watermark.
Translations
中国国家概况信息图
enGoal: Create a clean, modern country-profile infographic for {argument name="country name" default="China"}, titled “CHINA COUNTRY PROFILE,” with a large central 3D raised relief map and surrounding statistical cards. Canvas: 16:9 horizontal infographic, light gray background, crisp corporate editorial style, subtle shadows, red/blue/green accent colors, high-resolution vector-meets-3D look. Main map: Place a large raised 3D topographic map of China in the center, occupying most of the canvas. Use terrain coloring: orange-brown mountains in the west, yellow central plateau, green eastern lowlands and coast. Add white province borders and black province labels. Include Taiwan, Hainan, and small South China Sea islands as separate raised pieces. Put large spaced black letters “CHINA” across the center. Mark Beijing with a red star and label it. Visible map labels should include exactly 28 province/region/city labels: Xinjiang, Tibet (Xizang), Qinghai, Gansu, Inner Mongolia (Nei Mongol), Ningxia, Sichuan, Yunnan, Guizhou, Guangxi, Guangdong, Hainan, Fujian, Zhejiang, Jiangsu, Anhui, Shandong, Hubei, Hunan, Shaanxi, Shanxi, Beijing, Tianjin, Liaoning, Jilin, Heilongjiang, Taiwan, and China. Top-left title block: Big red headline “CHINA,” dark subtitle “COUNTRY PROFILE,” a thin red divider line, and a short paragraph: “China, officially the People’s Republic of China is a country in East Asia. It is the world’s most populous country, with a population of over 1.4 billion people.” Left statistics card: A tall rounded white card with exactly 5 stacked fact rows, each with a red circular icon and text. The 5 rows are: Population — {argument name="population value" default="1.41 Billion"} — World Rank: 1st; GDP (Nominal) — $17.79 Trillion — World Rank: 2nd; GDP Per Capita — $12,614 — World Rank: 63rd; Capital — {argument name="capital city" default="Beijing"}; Official Language — {argument name="official language" default="Chinese (Mandarin)"}. Use thin separators between rows. Top-right quick facts card: A rounded white card titled “QUICK FACTS” in red. Include exactly 4 rows with red icons: Government — Unitary One-Party Socialist Republic; Established — October 1, 1949; Land Area — 9.60 Million km², World Rank: 3rd; Population Density — ~147 People/km². Middle-right economic chart card: A rounded white card titled “ECONOMIC OVERVIEW” with subtitle “(Nominal GDP)” and small label “Trillion USD.” Include exactly 4 vertical bars for 2020, 2021, 2022, 2023 with values 14.72, 16.86, 17.96, 17.79. Use blue bars for 2020–2022 and a red bar for 2023. Bottom-left industry card: A rounded white card titled “INDUSTRY COMPOSITION (by GDP).” Include exactly 3-part donut chart segments: Industry 39.7% in blue, Services 53.2% in red, Agriculture 7.1% in green. Add matching legend with the same 3 labels and percentages. Bottom-center exports card: A rounded white card titled “MAJOR EXPORTS (2023).” Include exactly 5 export columns with blue line icons and red values: Electronic Products — $1.02 Trillion; Machinery & Equipment — $0.78 Trillion; Textiles & Clothing — $0.31 Trillion; Automotive Products — $0.26 Trillion; Chemical Products — $0.23 Trillion. Bottom-right trading partners card: A rounded white card titled “TOP TRADING PARTNERS (by Total Trade).” Include exactly 5 horizontal blue bars with small flag icons and values: United States — $664B; European Union — $643B; ASEAN — $596B; Hong Kong — $265B; Japan — $227B. Footer: Center a small source line reading “Source: World Bank, WTO, National Bureau of Statistics of China.” Constraints: Keep all cards aligned around the map without overlapping it, use consistent typography, red headings, blue chart elements, subtle drop shadows, rounded card corners, and no watermark.
中国国家概况信息图
zh-CN目标:为 {argument name="country name" default="中国"} 创建一份简洁、现代的国家概况信息图,标题为“中国国家概况”,中心放置大型 3D 浮雕地图,周围环绕统计数据卡片。 画布:16:9 横向信息图,浅灰色背景,清晰的企业编辑风格,柔和的阴影,红/蓝/绿强调色,高分辨率矢量与 3D 结合的外观。 主地图:在中心放置一张大型 3D 地形浮雕地图,占据画布大部分空间。使用地形配色:西部为橙褐色山脉,中部为黄色高原,东部和沿海为绿色低地。添加白色省界和黑色省份标签。将台湾、海南和南海诸岛作为独立的浮雕部分包含在内。在中心处放置醒目的黑色大写字母“CHINA”。用红色星号标记北京并标注。地图标签应准确包含 28 个省/自治区/直辖市标签:新疆、西藏、青海、甘肃、内蒙古、宁夏、四川、云南、贵州、广西、广东、海南、福建、浙江、江苏、安徽、山东、湖北、湖南、陕西、山西、北京、天津、辽宁、吉林、黑龙江、台湾和中国。 左上角标题栏:醒目的红色大标题“中国”,深色副标题“国家概况”,一条细红分割线,以及一段简短文字:“中国,全称中华人民共和国,是位于东亚的国家。它是世界上人口最多的国家,人口超过 14 亿。” 左侧统计卡片:一张圆角白色长卡片,包含 5 行堆叠的事实数据,每行配有红色圆形图标和文字。5 行内容为:人口 — {argument name="population value" default="14.1 亿"} — 世界排名:第 1;GDP(名义) — 17.79 万亿美元 — 世界排名:第 2;人均 GDP — 12,614 美元 — 世界排名:第 63;首都 — {argument name="capital city" default="北京"};官方语言 — {argument name="official language" default="中文(普通话)"}。行与行之间使用细分割线。 右上角概况卡片:一张圆角白色卡片,标题为红色的“概况”。包含 4 行红色图标内容:政府 — 单一制社会主义共和国;成立日期 — 1949 年 10 月 1 日;土地面积 — 960 万平方公里,世界排名:第 3;人口密度 — 约 147 人/平方公里。 中右侧经济图表卡片:一张圆角白色卡片,标题为“经济概览”,副标题为“(名义 GDP)”,并附有小标签“万亿美元”。包含 4 根垂直柱状图,分别代表 2020、2021、2022、2023 年,数值分别为 14.72、16.86、17.96、17.79。2020–2022 年使用蓝色柱状,2023 年使用红色柱状。 左下角产业卡片:一张圆角白色卡片,标题为“产业构成 (按 GDP)”。包含 3 部分组成的环形图:蓝色代表工业 39.7%,红色代表服务业 53.2%,绿色代表农业 7.1%。添加带有相同 3 个标签和百分比的图例。 底部中心出口卡片:一张圆角白色卡片,标题为“主要出口产品 (2023 年)”。包含 5 列出口数据,配有蓝色线条图标和红色数值:电子产品 — 1.02 万亿美元;机械设备 — 0.78 万亿美元;纺织服装 — 0.31 万亿美元;汽车产品 — 0.26 万亿美元;化学产品 — 0.23 万亿美元。 右下角贸易伙伴卡片:一张圆角白色卡片,标题为“主要贸易伙伴 (按贸易总额)”。包含 5 条蓝色水平柱状图,配有小型旗帜图标和数值:美国 — 6640 亿美元;欧盟 — 6430 亿美元;东盟 — 5960 亿美元;中国香港 — 2650 亿美元;日本 — 2270 亿美元。 页脚:居中放置一行小字来源说明:“数据来源:世界银行、世界贸易组织、中国国家统计局。” 约束条件:所有卡片需围绕地图排列且互不重叠,使用统一的字体,红色标题,蓝色图表元素,柔和的投影,圆角卡片,且不得添加水印。