奶油风中国离婚数据图表
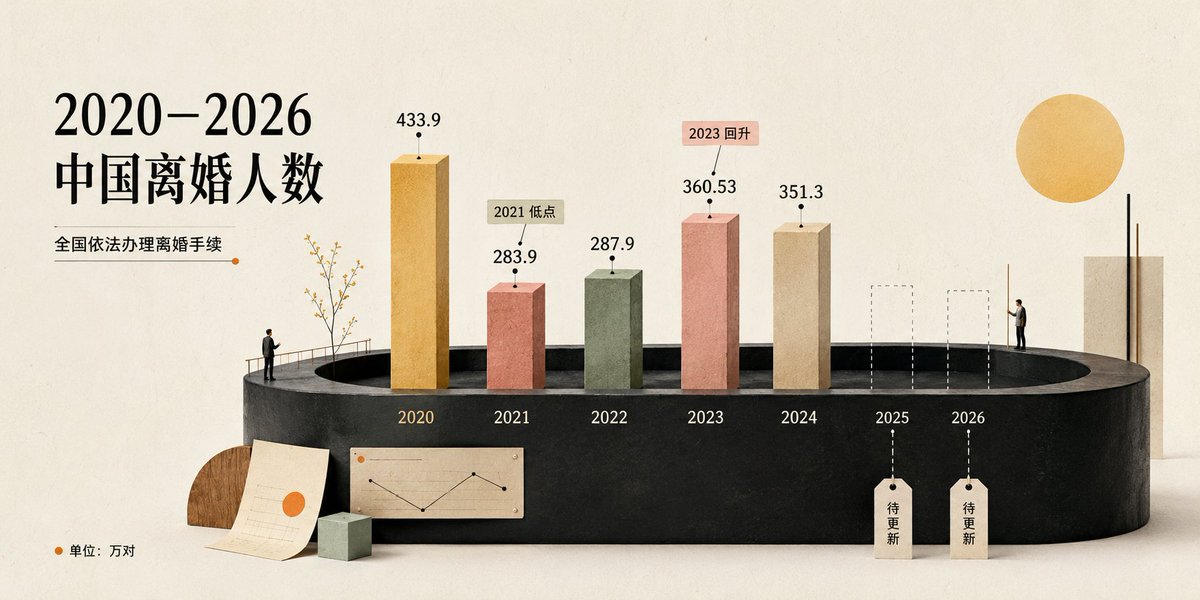
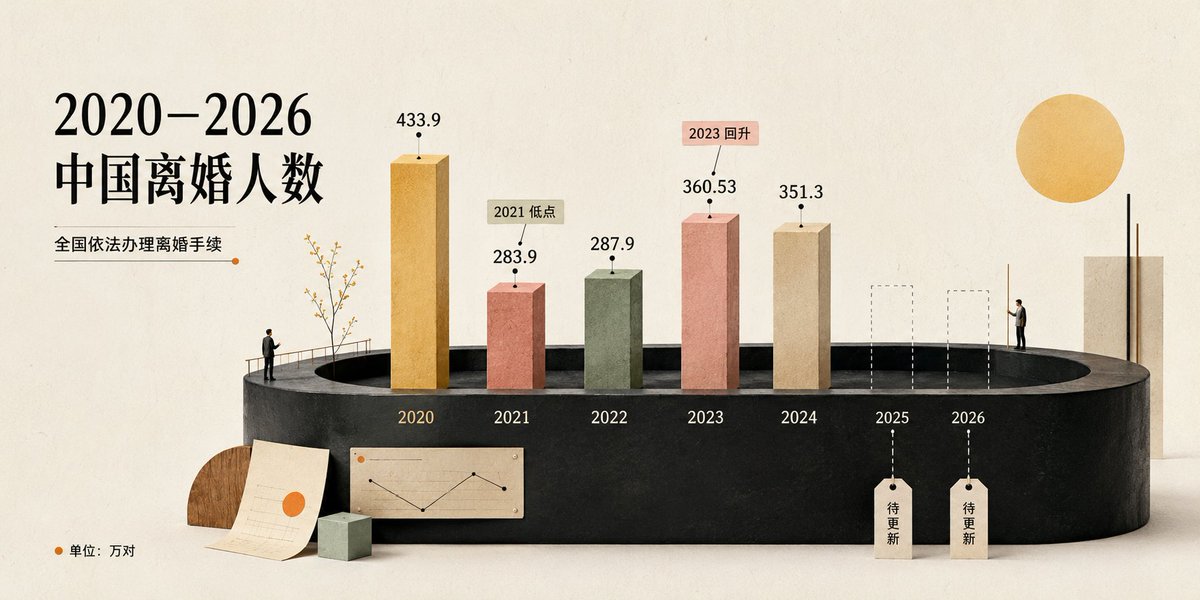
生成一张温暖奶油色调的 3D 编辑风格信息图,可视化展示 2020 年至 2026 年中国离婚人数,适用于社交媒体或演示文稿。
- Category
- Charts & Infographics
- Model
- GPT Image 2
- Creator
- 小小东
- Source language
- en
- Source ID
- 20872
- Published
- May 16, 2026
Full prompt
Goal: Create a cream-toned 3D editorial data visualization poster about {argument name="headline text" default="2020–2026 中国离婚人数"}, showing divorce counts in China with a refined miniature diorama style.

Canvas: Wide horizontal 2:1 composition, warm off-white paper background with subtle grain, soft shadows, minimalist premium infographic aesthetic. Use a muted cream, black, terracotta, sage, ochre, and beige palette.

Layout: Place the main title on the upper left in large elegant black serif Chinese typography. Under it, add the subtitle {argument name="subtitle text" default="全国依法办理离婚手续"} with a thin horizontal rule ending in a small orange dot. The central focus is a black oval/cylindrical stage platform spanning the lower middle of the image, viewed in slight perspective. On the platform, arrange exactly 7 year positions from left to right: 2020, 2021, 2022, 2023, 2024, 2025, 2026.

Data bars: Show exactly 5 solid rectangular 3D vertical bars for years 2020–2024 and exactly 2 dashed-outline placeholder bars for 2025 and 2026. Use these visible values and labels: 2020 ochre-gold tall bar labeled 433.9; 2021 terracotta bar labeled 283.9 with a small callout tag reading “2021 低点”; 2022 muted sage-green bar labeled 287.9; 2023 salmon-pink bar labeled 360.53 with a small callout tag reading “2023 回升”; 2024 beige bar labeled 351.3; 2025 dashed empty bar with a hanging tag reading “待更新”; 2026 dashed empty bar with a hanging tag reading “待更新”. Put each year label in white or pale text along the front face of the black platform beneath its position.

Supporting visual elements: Include exactly 2 miniature human figures: one standing near the left side of the stage railing looking toward the chart, and one standing on the right side near the 2026 area. Include a delicate small tree with thin branches near the 2020 bar. Add one large warm yellow sun circle in the upper right. Add a tall cream rectangular architectural block at the far right behind the platform. At the lower left foreground, add exactly 3 desk-like props: one semicircular wood block, one off-white paper sheet with faint chart lines and an orange dot, and one small pale green cube. On the front lower center of the platform, add one small beige inset chart card showing a simple black line chart with an orange dot.

Legend and text: In the bottom-left corner, add an orange dot followed by “单位:万对”. Keep all Chinese text crisp and readable. Use the data source/style as a polished social-media infographic, not a scientific chart.

Style constraints: Soft natural lighting, realistic paper and plaster textures, subtle 3D depth, clean negative space, no watermark, no extra years, no extra bars, no additional text beyond the specified labels. Use {argument name="background color" default="warm ivory"} as the overall background tone and {argument name="accent color" default="orange"} for dots and highlights.
Translations
奶油风中国离婚数据图表
enGoal: Create a cream-toned 3D editorial data visualization poster about {argument name="headline text" default="2020–2026 中国离婚人数"}, showing divorce counts in China with a refined miniature diorama style. Canvas: Wide horizontal 2:1 composition, warm off-white paper background with subtle grain, soft shadows, minimalist premium infographic aesthetic. Use a muted cream, black, terracotta, sage, ochre, and beige palette. Layout: Place the main title on the upper left in large elegant black serif Chinese typography. Under it, add the subtitle {argument name="subtitle text" default="全国依法办理离婚手续"} with a thin horizontal rule ending in a small orange dot. The central focus is a black oval/cylindrical stage platform spanning the lower middle of the image, viewed in slight perspective. On the platform, arrange exactly 7 year positions from left to right: 2020, 2021, 2022, 2023, 2024, 2025, 2026. Data bars: Show exactly 5 solid rectangular 3D vertical bars for years 2020–2024 and exactly 2 dashed-outline placeholder bars for 2025 and 2026. Use these visible values and labels: 2020 ochre-gold tall bar labeled 433.9; 2021 terracotta bar labeled 283.9 with a small callout tag reading “2021 低点”; 2022 muted sage-green bar labeled 287.9; 2023 salmon-pink bar labeled 360.53 with a small callout tag reading “2023 回升”; 2024 beige bar labeled 351.3; 2025 dashed empty bar with a hanging tag reading “待更新”; 2026 dashed empty bar with a hanging tag reading “待更新”. Put each year label in white or pale text along the front face of the black platform beneath its position. Supporting visual elements: Include exactly 2 miniature human figures: one standing near the left side of the stage railing looking toward the chart, and one standing on the right side near the 2026 area. Include a delicate small tree with thin branches near the 2020 bar. Add one large warm yellow sun circle in the upper right. Add a tall cream rectangular architectural block at the far right behind the platform. At the lower left foreground, add exactly 3 desk-like props: one semicircular wood block, one off-white paper sheet with faint chart lines and an orange dot, and one small pale green cube. On the front lower center of the platform, add one small beige inset chart card showing a simple black line chart with an orange dot. Legend and text: In the bottom-left corner, add an orange dot followed by “单位:万对”. Keep all Chinese text crisp and readable. Use the data source/style as a polished social-media infographic, not a scientific chart. Style constraints: Soft natural lighting, realistic paper and plaster textures, subtle 3D depth, clean negative space, no watermark, no extra years, no extra bars, no additional text beyond the specified labels. Use {argument name="background color" default="warm ivory"} as the overall background tone and {argument name="accent color" default="orange"} for dots and highlights.
奶油风中国离婚数据图表
zh-CN目标:创建一个奶油风格的编辑类数据可视化海报,主题为 {argument name="headline text" default="2020–2026 中国离婚人数"},以微缩 3D 柱状图装置的形式展示 2020 年至 2026 年中国的离婚人数。 画布:宽屏 16:9 构图,温暖的象牙白纸张背景,带有细腻纹理,柔和的摄影棚灯光,留白充足,呈现精致的杂志信息图质感。 布局:左侧放置醒目的黑色衬线体中文标题,分为两行:“2020–2026” 和 “中国离婚人数”。下方添加副标题“全国依法办理离婚手续”,并配有一条以小橙点结尾的细横线。左下角添加一个橙点和标注“单位:万对”。主图表位于中下部,放置在一个哑光黑色椭圆/圆柱形底座上,以微透视视角呈现。年份标签印在底座的前缘。 数据与图表元素:使用 7 个年份位置,分别标注为 2020、2021、2022、2023、2024、2025、2026。展示 5 根实心 3D 柱状图和 2 根未来预测占位柱。5 根实心柱分别为:2020 年高大的金色柱,标注“433.9”;2021 年较矮的赤陶红柱,标注“283.9”,配有米色标注标签“2021 低点”;2022 年柔和的鼠尾草绿柱,标注“287.9”;2023 年鲑鱼粉色柱,标注“360.53”,配有粉色标注标签“2023 回升”;2024 年米色柱,标注“351.3”。2 个未来占位柱为:2025 年和 2026 年,显示为虚线轮廓的透明矩形柱,每根柱子下方有虚线引导线连接到一个写有“待更新”的悬挂纸签。在柱状图上方使用黑点标记,并使用细引导线连接数值标签和标注。 装饰性场景细节:添加微型人物以体现比例:一个小人站在底座左侧边缘,靠近一棵精致的无叶装饰树和栏杆;另一个小人站在右侧,靠近未来的占位柱。在底座前方放置一张带有简单折线图和橙点的小纸片、一个小淡绿色立方体,以及纸片后方的一个半圆形木质装饰。最右侧添加一块高大的米色矩形板,板上有两根细黑色垂直杆,上方有一个巨大的金色太阳状圆环。 视觉风格:柔和的奶油色美学,触感纸张和粘土纹理,采用黑色、象牙白、赭石色、赤陶色、鼠尾草绿、鲑鱼粉、米色和暖木色的柔和色调。标题采用优雅的衬线字体,数字和小标签采用简洁的无衬线字体。使用逼真的柔和阴影,微缩模型比例,高端编辑类数据可视化,风格沉稳且精致。 约束条件:保持所有可见中文文本与指定内容完全一致,使用指定的 7 个年份标签和 5 个数值,不得添加额外的柱状图、图例、Logo、水印或无关文本。