Desk Setup Audit Infographic
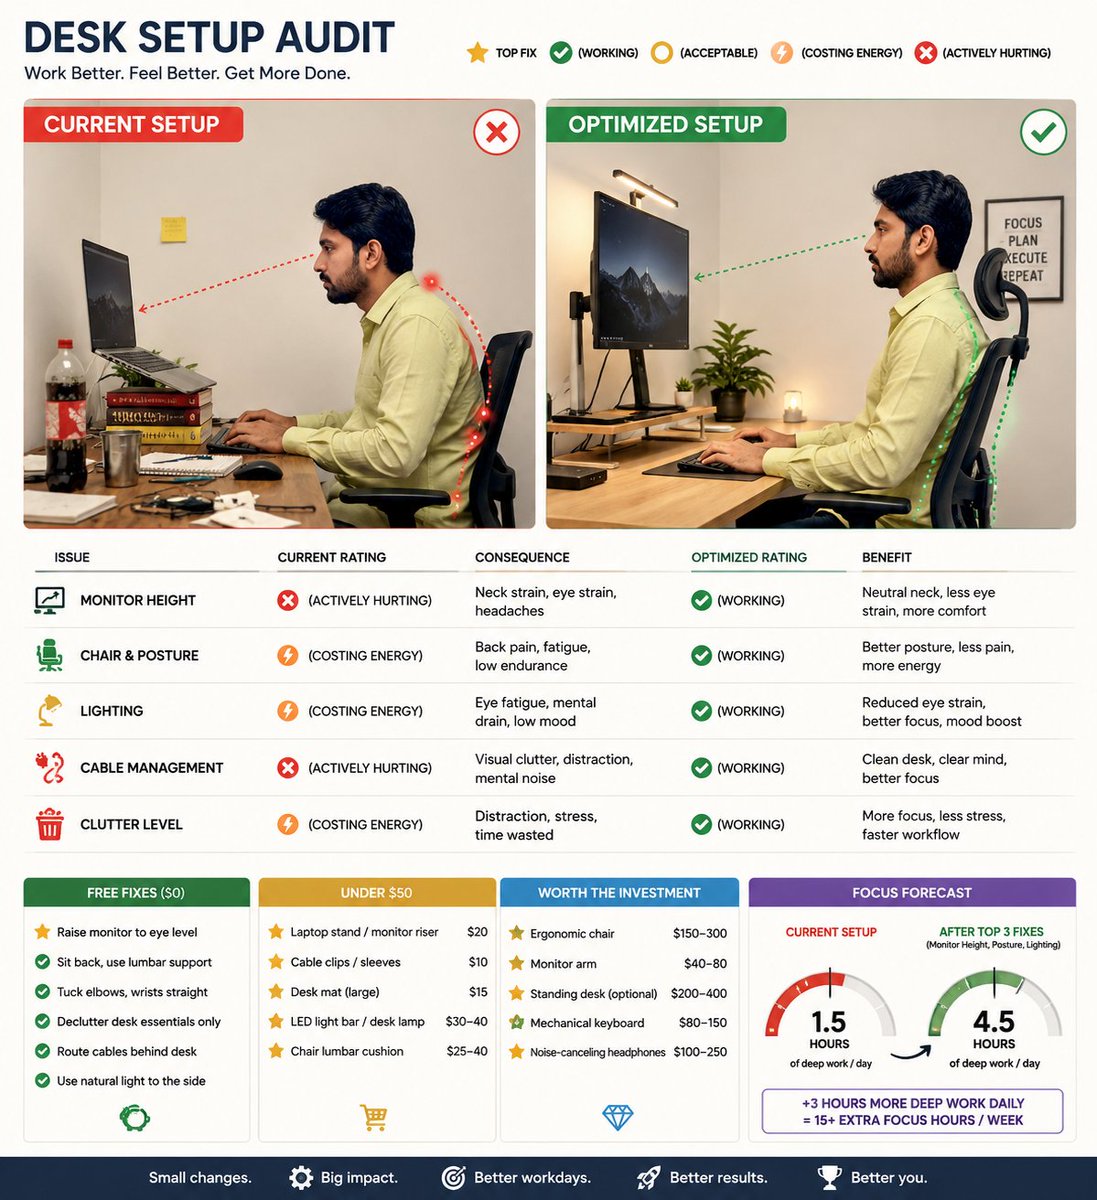
Create a visual-first, editorial-style infographic auditing the desk setup in the attached photo. Show a side-by-side of current vs. optimized setup with annotations on monitor hei
- Category
- UI & Interfaces
- Model
- GPT Image 2
- Creator
- EvoLinkAI
- Source language
- en
- Source ID
- ui-156
Full prompt
Create a visual-first, editorial-style infographic auditing the desk setup in the attached photo. Show a side-by-side of current vs. optimized setup with annotations on monitor height, chair position, lighting, cable management, and clutter. Rate each issue with symbols like Top Fix, (working), (acceptable), (costing energy), and (actively hurting), tying each to a consequence like back pain, eye strain, or focus loss. Rank fixes by impact and group them into free fixes, under $50, and worth the investment. Include a Focus Forecast gauge predicting daily deep work hours possible with the current setup vs. after the top 3 fixes. Keep it clean, minimal text, no paragraphs.
Translations
Desk Setup Audit Infographic
deCreate a visual-first, editorial-style infographic auditing the desk setup in the attached photo. Show a side-by-side of current vs. optimized setup with annotations on monitor height, chair position, lighting, cable management, and clutter. Rate each issue with symbols like Top Fix, (working), (acceptable), (costing energy), and (actively hurting), tying each to a consequence like back pain, eye strain, or focus loss. Rank fixes by impact and group them into free fixes, under $50, and worth the investment. Include a Focus Forecast gauge predicting daily deep work hours possible with the current setup vs. after the top 3 fixes. Keep it clean, minimal text, no paragraphs.
Desk Setup Audit Infographic
enCreate a visual-first, editorial-style infographic auditing the desk setup in the attached photo. Show a side-by-side of current vs. optimized setup with annotations on monitor height, chair position, lighting, cable management, and clutter. Rate each issue with symbols like Top Fix, (working), (acceptable), (costing energy), and (actively hurting), tying each to a consequence like back pain, eye strain, or focus loss. Rank fixes by impact and group them into free fixes, under $50, and worth the investment. Include a Focus Forecast gauge predicting daily deep work hours possible with the current setup vs. after the top 3 fixes. Keep it clean, minimal text, no paragraphs.
Desk Setup Audit Infographic
esCreate a visual-first, editorial-style infographic auditing the desk setup in the attached photo. Show a side-by-side of current vs. optimized setup with annotations on monitor height, chair position, lighting, cable management, and clutter. Rate each issue with symbols like Top Fix, (working), (acceptable), (costing energy), and (actively hurting), tying each to a consequence like back pain, eye strain, or focus loss. Rank fixes by impact and group them into free fixes, under $50, and worth the investment. Include a Focus Forecast gauge predicting daily deep work hours possible with the current setup vs. after the top 3 fixes. Keep it clean, minimal text, no paragraphs.
Desk Setup Audit Infographic
frCreate a visual-first, editorial-style infographic auditing the desk setup in the attached photo. Show a side-by-side of current vs. optimized setup with annotations on monitor height, chair position, lighting, cable management, and clutter. Rate each issue with symbols like Top Fix, (working), (acceptable), (costing energy), and (actively hurting), tying each to a consequence like back pain, eye strain, or focus loss. Rank fixes by impact and group them into free fixes, under $50, and worth the investment. Include a Focus Forecast gauge predicting daily deep work hours possible with the current setup vs. after the top 3 fixes. Keep it clean, minimal text, no paragraphs.
Desk Setup Audit Infographic
jaCreate a visual-first, editorial-style infographic auditing the desk setup in the attached photo. Show a side-by-side of current vs. optimized setup with annotations on monitor height, chair position, lighting, cable management, and clutter. Rate each issue with symbols like Top Fix, (working), (acceptable), (costing energy), and (actively hurting), tying each to a consequence like back pain, eye strain, or focus loss. Rank fixes by impact and group them into free fixes, under $50, and worth the investment. Include a Focus Forecast gauge predicting daily deep work hours possible with the current setup vs. after the top 3 fixes. Keep it clean, minimal text, no paragraphs.
Desk Setup Audit Infographic
koCreate a visual-first, editorial-style infographic auditing the desk setup in the attached photo. Show a side-by-side of current vs. optimized setup with annotations on monitor height, chair position, lighting, cable management, and clutter. Rate each issue with symbols like Top Fix, (working), (acceptable), (costing energy), and (actively hurting), tying each to a consequence like back pain, eye strain, or focus loss. Rank fixes by impact and group them into free fixes, under $50, and worth the investment. Include a Focus Forecast gauge predicting daily deep work hours possible with the current setup vs. after the top 3 fixes. Keep it clean, minimal text, no paragraphs.
Desk Setup Audit Infographic
ptCreate a visual-first, editorial-style infographic auditing the desk setup in the attached photo. Show a side-by-side of current vs. optimized setup with annotations on monitor height, chair position, lighting, cable management, and clutter. Rate each issue with symbols like Top Fix, (working), (acceptable), (costing energy), and (actively hurting), tying each to a consequence like back pain, eye strain, or focus loss. Rank fixes by impact and group them into free fixes, under $50, and worth the investment. Include a Focus Forecast gauge predicting daily deep work hours possible with the current setup vs. after the top 3 fixes. Keep it clean, minimal text, no paragraphs.
Desk Setup Audit Infographic
ruCreate a visual-first, editorial-style infographic auditing the desk setup in the attached photo. Show a side-by-side of current vs. optimized setup with annotations on monitor height, chair position, lighting, cable management, and clutter. Rate each issue with symbols like Top Fix, (working), (acceptable), (costing energy), and (actively hurting), tying each to a consequence like back pain, eye strain, or focus loss. Rank fixes by impact and group them into free fixes, under $50, and worth the investment. Include a Focus Forecast gauge predicting daily deep work hours possible with the current setup vs. after the top 3 fixes. Keep it clean, minimal text, no paragraphs.
Desk Setup Audit Infographic
trCreate a visual-first, editorial-style infographic auditing the desk setup in the attached photo. Show a side-by-side of current vs. optimized setup with annotations on monitor height, chair position, lighting, cable management, and clutter. Rate each issue with symbols like Top Fix, (working), (acceptable), (costing energy), and (actively hurting), tying each to a consequence like back pain, eye strain, or focus loss. Rank fixes by impact and group them into free fixes, under $50, and worth the investment. Include a Focus Forecast gauge predicting daily deep work hours possible with the current setup vs. after the top 3 fixes. Keep it clean, minimal text, no paragraphs.
Desk Setup Audit Infographic
zh-CNCreate a visual-first, editorial-style infographic auditing the desk setup in the attached photo. Show a side-by-side of current vs. optimized setup with annotations on monitor height, chair position, lighting, cable management, and clutter. Rate each issue with symbols like Top Fix, (working), (acceptable), (costing energy), and (actively hurting), tying each to a consequence like back pain, eye strain, or focus loss. Rank fixes by impact and group them into free fixes, under $50, and worth the investment. Include a Focus Forecast gauge predicting daily deep work hours possible with the current setup vs. after the top 3 fixes. Keep it clean, minimal text, no paragraphs.
Desk Setup Audit Infographic
zh-TWCreate a visual-first, editorial-style infographic auditing the desk setup in the attached photo. Show a side-by-side of current vs. optimized setup with annotations on monitor height, chair position, lighting, cable management, and clutter. Rate each issue with symbols like Top Fix, (working), (acceptable), (costing energy), and (actively hurting), tying each to a consequence like back pain, eye strain, or focus loss. Rank fixes by impact and group them into free fixes, under $50, and worth the investment. Include a Focus Forecast gauge predicting daily deep work hours possible with the current setup vs. after the top 3 fixes. Keep it clean, minimal text, no paragraphs.