Dense 与 MoE 神经网络信息图
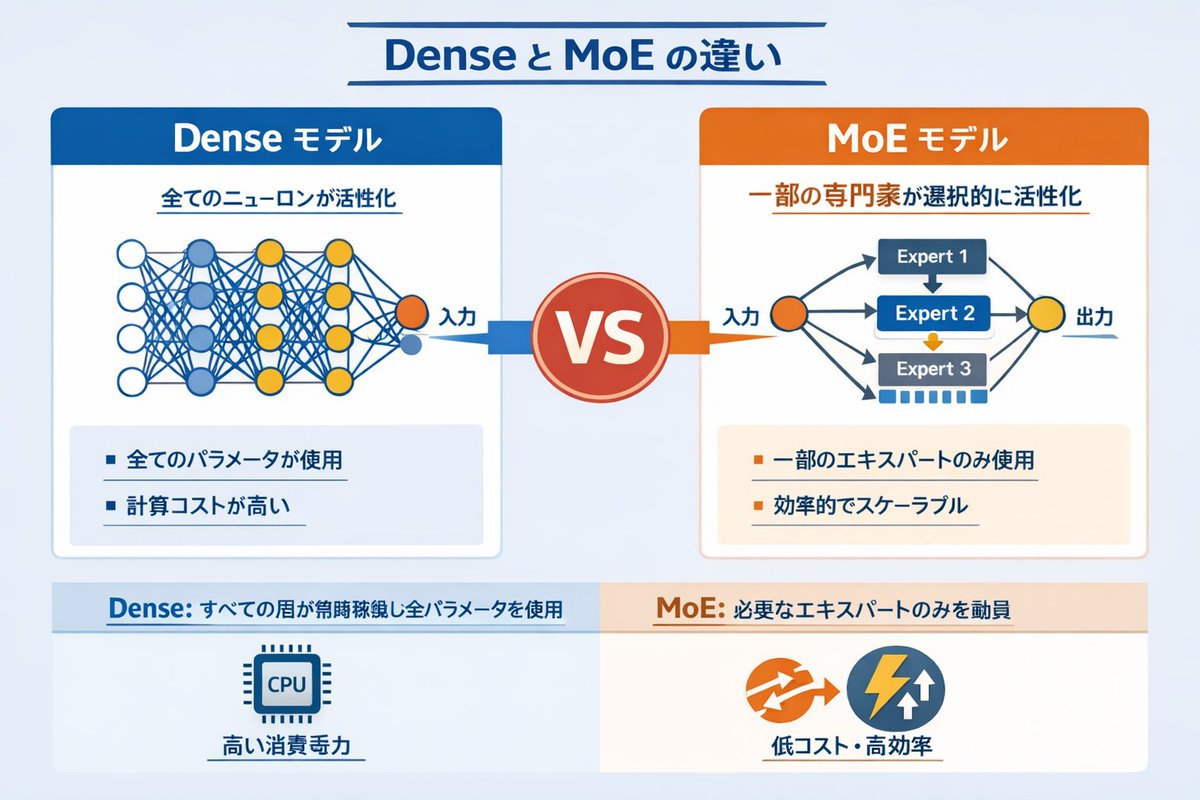
一份技术信息图,通过网络图和要点对比了 Dense 和 Mixture of Experts (MoE) AI 模型。
- Category
- Charts & Infographics
- Model
- GPT Image 2
- Creator
- Vania
- Source language
- en
- Source ID
- 13633
- Published
- Apr 14, 2026
Full prompt
{
  "type": "infographic comparison diagram",
  "header": {
    "title": "{argument name=\"main title\" default=\"Dense と MoE の違い\"}"
  },
  "layout": {
    "structure": "two main columns separated by a central VS badge, with a split footer at the bottom",
    "sections": [
      {
        "position": "left column",
        "theme_color": "blue",
        "header": "{argument name=\"left model name\" default=\"Dense モデル\"}",
        "subtitle": "全てのニューロンが活性化",
        "diagram": {
          "type": "fully connected neural network",
          "elements": [
            "1 orange input node labeled 入力",
            "4 hidden layers with 4, 5, 4, and 2 nodes respectively",
            "nodes colored white, blue, and yellow",
            "dense intersecting connection lines between all adjacent nodes"
          ]
        },
        "bullet_points": {
          "count": 2,
          "items": [
            "{argument name=\"left bullet point\" default=\"全てのパラメータが使用\"}",
            "計算コストが高い"
          ]
        }
      },
      {
        "position": "right column",
        "theme_color": "orange",
        "header": "{argument name=\"right model name\" default=\"MoE モデル\"}",
        "subtitle": "一部の専門家が選択的に活性化",
        "diagram": {
          "type": "mixture of experts network",
          "elements": [
            "1 orange input node labeled 入力",
            "3 rectangular blocks labeled Expert 1, Expert 2, Expert 3",
            "1 yellow output node labeled 出力",
            "branching arrows connecting input to experts, and experts to output"
          ]
        },
        "bullet_points": {
          "count": 2,
          "items": [
            "{argument name=\"right bullet point\" default=\"一部のエキスパートのみ使用\"}",
            "効率的でスケーラブル"
          ]
        }
      },
      {
        "position": "center",
        "element": "red circular badge with text VS",
        "connections": "blue arrow pointing left, orange arrow pointing right"
      },
      {
        "position": "footer left",
        "background": "light blue",
        "text": "Dense: すべての層が常時稼働し全パラメータを使用",
        "icon": "1 CPU chip graphic",
        "label": "高い消費電力"
      },
      {
        "position": "footer right",
        "background": "light orange",
        "text": "MoE: 必要なエキスパートのみを動員",
        "icons": "2 circular graphics (orange arrows, blue lightning bolt)",
        "label": "低コスト・高効率"
      }
    ]
  }
}
Translations
Dense 与 MoE 神经网络信息图
en{ "type": "infographic comparison diagram", "header": { "title": "{argument name=\"main title\" default=\"Dense と MoE の違い\"}" }, "layout": { "structure": "two main columns separated by a central VS badge, with a split footer at the bottom", "sections": [ { "position": "left column", "theme_color": "blue", "header": "{argument name=\"left model name\" default=\"Dense モデル\"}", "subtitle": "全てのニューロンが活性化", "diagram": { "type": "fully connected neural network", "elements": [ "1 orange input node labeled 入力", "4 hidden layers with 4, 5, 4, and 2 nodes respectively", "nodes colored white, blue, and yellow", "dense intersecting connection lines between all adjacent nodes" ] }, "bullet_points": { "count": 2, "items": [ "{argument name=\"left bullet point\" default=\"全てのパラメータが使用\"}", "計算コストが高い" ] } }, { "position": "right column", "theme_color": "orange", "header": "{argument name=\"right model name\" default=\"MoE モデル\"}", "subtitle": "一部の専門家が選択的に活性化", "diagram": { "type": "mixture of experts network", "elements": [ "1 orange input node labeled 入力", "3 rectangular blocks labeled Expert 1, Expert 2, Expert 3", "1 yellow output node labeled 出力", "branching arrows connecting input to experts, and experts to output" ] }, "bullet_points": { "count": 2, "items": [ "{argument name=\"right bullet point\" default=\"一部のエキスパートのみ使用\"}", "効率的でスケーラブル" ] } }, { "position": "center", "element": "red circular badge with text VS", "connections": "blue arrow pointing left, orange arrow pointing right" }, { "position": "footer left", "background": "light blue", "text": "Dense: すべての層が常時稼働し全パラメータを使用", "icon": "1 CPU chip graphic", "label": "高い消費電力" }, { "position": "footer right", "background": "light orange", "text": "MoE: 必要なエキスパートのみを動員", "icons": "2 circular graphics (orange arrows, blue lightning bolt)", "label": "低コスト・高効率" } ] } }
Dense 与 MoE 神经网络信息图
zh-CN{ "type": "信息图对比图", "header": { "title": "{argument name=\"main title\" default=\"Dense 与 MoE 的区别\"}" }, "layout": { "structure": "两列式布局,中间由 VS 徽章分隔,底部设有分栏页脚", "sections": [ { "position": "左侧栏", "theme_color": "蓝色", "header": "{argument name=\"left model name\" default=\"Dense 模型\"}", "subtitle": "所有神经元均被激活", "diagram": { "type": "全连接神经网络", "elements": [ "1 个橙色输入节点,标注为“输入”", "4 个隐藏层,节点数分别为 4、5、4 和 2", "节点颜色为白色、蓝色和黄色", "所有相邻节点间密集的交叉连接线" ] }, "bullet_points": { "count": 2, "items": [ "{argument name=\"left bullet point\" default=\"使用所有参数\"}", "计算成本高" ] } }, { "position": "右侧栏", "theme_color": "橙色", "header": "{argument name=\"right model name\" default=\"MoE 模型\"}", "subtitle": "选择性激活部分专家", "diagram": { "type": "混合专家网络", "elements": [ "1 个橙色输入节点,标注为“输入”", "3 个矩形块,分别标注为 Expert 1、Expert 2、Expert 3", "1 个黄色输出节点,标注为“输出”", "连接输入到专家、以及专家到输出的分支箭头" ] }, "bullet_points": { "count": 2, "items": [ "{argument name=\"right bullet point\" default=\"仅使用部分专家\"}", "高效且可扩展" ] } }, { "position": "中心", "element": "带有 VS 文字的红色圆形徽章", "connections": "指向左侧的蓝色箭头,指向右侧的橙色箭头" }, { "position": "页脚左侧", "background": "浅蓝色", "text": "Dense:所有层常驻运行并使用全部参数", "icon": "1 个 CPU 芯片图形", "label": "高功耗" }, { "position": "页脚右侧", "background": "浅橙色", "text": "MoE:仅调用必要的专家", "icons": "2 个圆形图形(橙色箭头、蓝色闪电)", "label": "低成本、高效率" } ] } }