编辑级双轴数据信息图
生成简洁的报纸风格双轴折线图,包含注释和标注框,非常适合对比呈现截然不同的数据趋势。
- Category
- Charts & Infographics
- Model
- GPT Image 2
- Creator
- Alex Patrascu
- Source language
- en
- Source ID
- 13622
- Published
- Apr 14, 2026
Full prompt
{
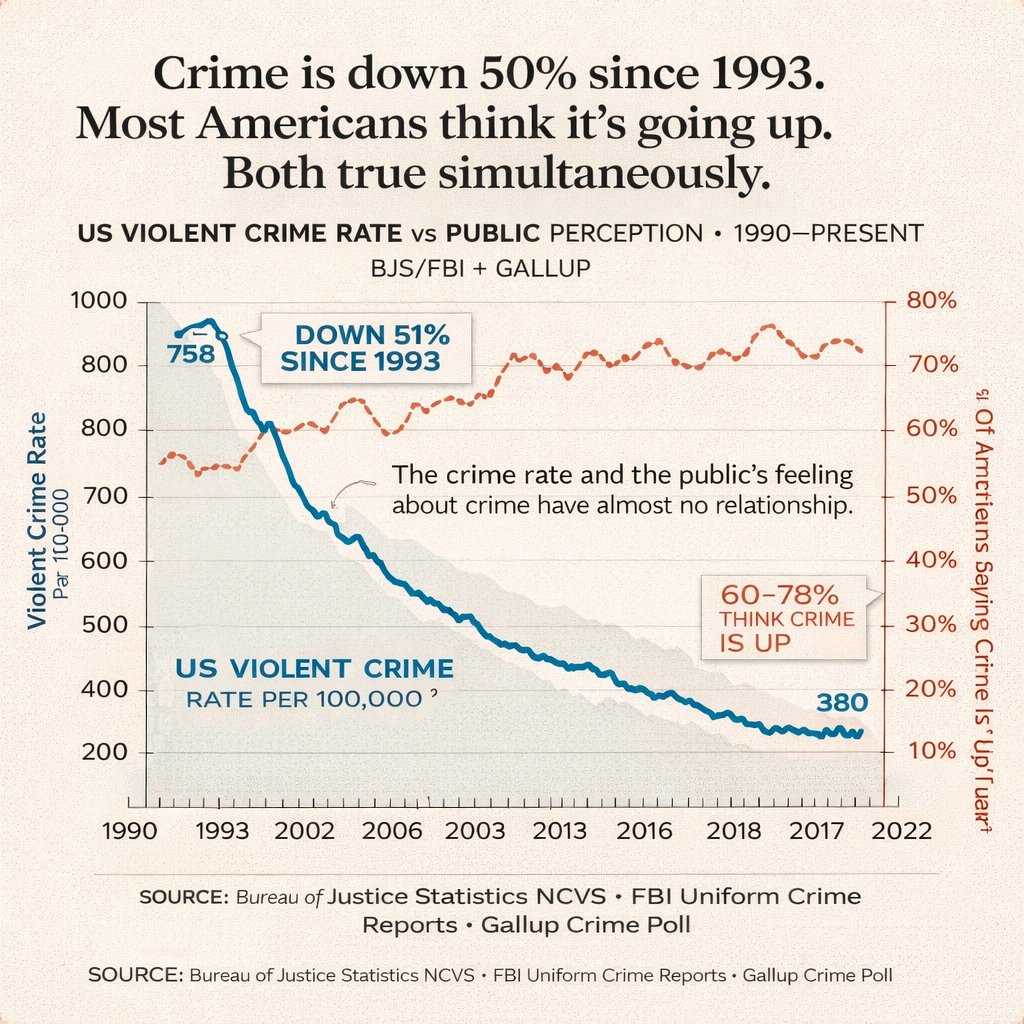
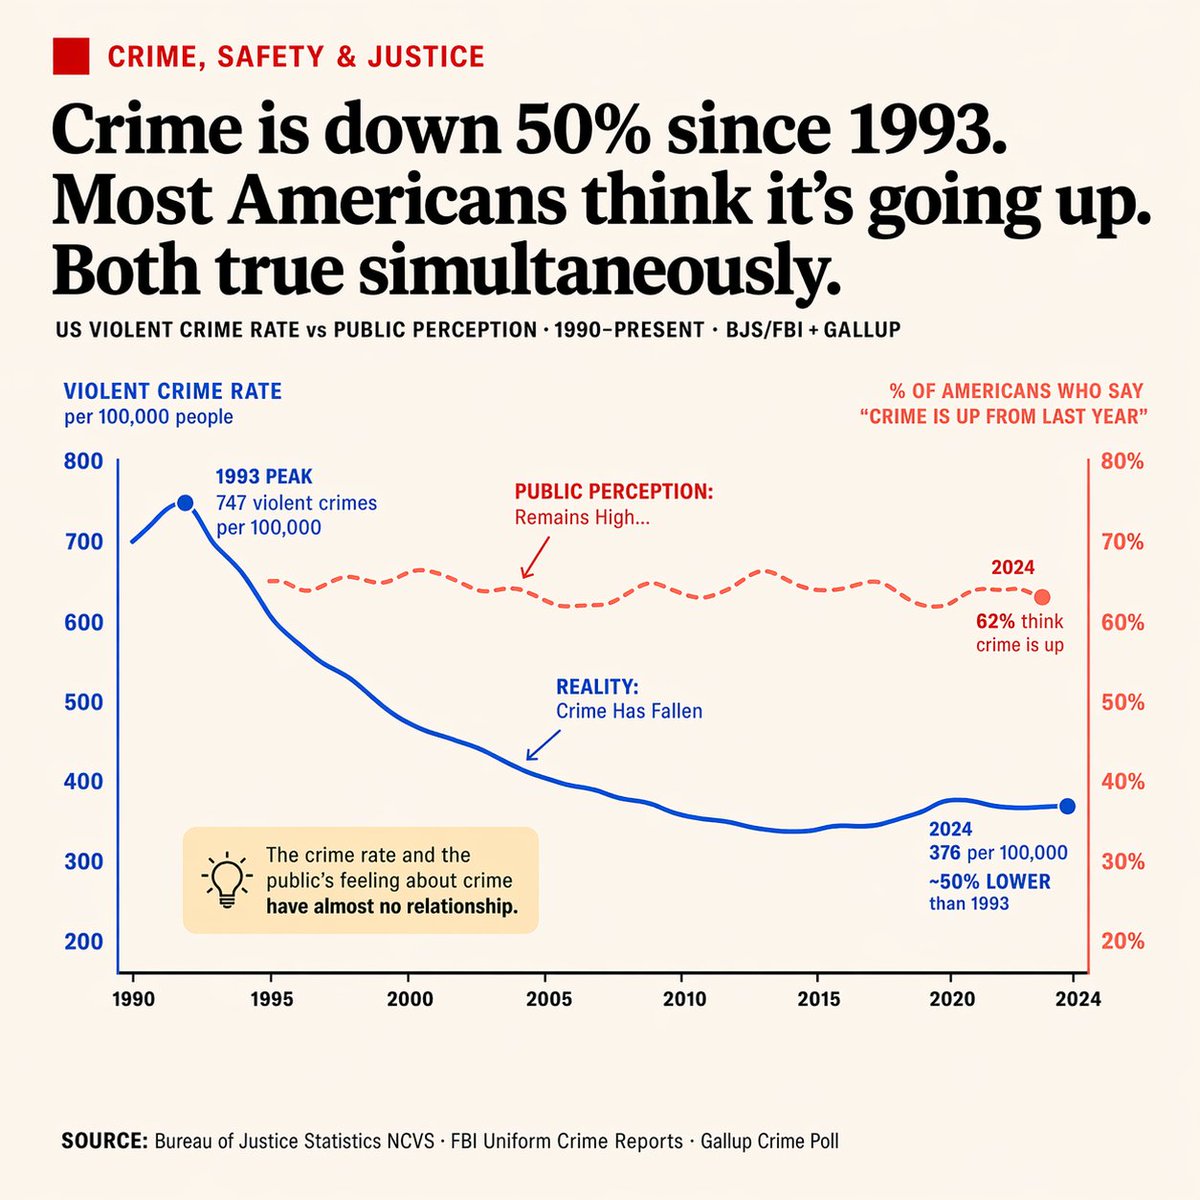
"type": "editorial infographic dual-axis line chart",
"style": "clean, newspaper-style, off-white background, highly legible typography",
"header": {
"category": "CRIME, SAFETY & JUSTICE (red text with red square icon)",
"headline": "{argument name=\"main headline\" default=\"Crime is down 50% since 1993. Most Americans think it's going up. Both true simultaneously.\"}",
"sub_headline": "US VIOLENT CRIME RATE vs PUBLIC PERCEPTION · 1990-PRESENT · BJS/FBI + GALLUP"
},
"chart": {
"x_axis": "Years 1990 to 2024 with 8 tick marks",
"left_y_axis": {
"color": "blue",
"label": "{argument name=\"left axis label\" default=\"VIOLENT CRIME RATE per 100,000 people\"}",
"range": "200 to 800"
},
"right_y_axis": {
"color": "red",
"label": "{argument name=\"right axis label\" default=\"% OF AMERICANS WHO SAY 'CRIME IS UP FROM LAST YEAR'\"}",
"range": "20% to 80%"
},
"data_series": [
{
"name": "Reality",
"style": "solid blue line",
"trend": "peaks early then drops significantly",
"annotations": [
"1993 PEAK 747 violent crimes per 100,000 (with blue dot)",
"REALITY: Crime Has Fallen (with blue arrow pointing to line)",
"2024 376 per 100,000 ~50% LOWER than 1993 (with blue dot)"
]
},
{
"name": "Public Perception",
"style": "dashed red line",
"trend": "remains relatively flat and high",
"annotations": [
"PUBLIC PERCEPTION: Remains High... (with red arrow pointing to line)",
"2024 62% think crime is up (with red dot)"
]
}
]
},
"callout_box": {
"position": "bottom left inside chart area",
"style": "light yellow rectangle",
"icon": "lightbulb",
"text": "{argument name=\"callout text\" default=\"The crime rate and the public's feeling about crime have almost no relationship.\"}"
},
"footer": {
"text": "SOURCE: {argument name=\"footer source\" default=\"Bureau of Justice Statistics NCVS · FBI Uniform Crime Reports · Gallup Crime Poll\"}"
}
}Translations
编辑级双轴数据信息图
en{ "type": "editorial infographic dual-axis line chart", "style": "clean, newspaper-style, off-white background, highly legible typography", "header": { "category": "CRIME, SAFETY & JUSTICE (red text with red square icon)", "headline": "{argument name=\"main headline\" default=\"Crime is down 50% since 1993. Most Americans think it's going up. Both true simultaneously.\"}", "sub_headline": "US VIOLENT CRIME RATE vs PUBLIC PERCEPTION · 1990-PRESENT · BJS/FBI + GALLUP" }, "chart": { "x_axis": "Years 1990 to 2024 with 8 tick marks", "left_y_axis": { "color": "blue", "label": "{argument name=\"left axis label\" default=\"VIOLENT CRIME RATE per 100,000 people\"}", "range": "200 to 800" }, "right_y_axis": { "color": "red", "label": "{argument name=\"right axis label\" default=\"% OF AMERICANS WHO SAY 'CRIME IS UP FROM LAST YEAR'\"}", "range": "20% to 80%" }, "data_series": [ { "name": "Reality", "style": "solid blue line", "trend": "peaks early then drops significantly", "annotations": [ "1993 PEAK 747 violent crimes per 100,000 (with blue dot)", "REALITY: Crime Has Fallen (with blue arrow pointing to line)", "2024 376 per 100,000 ~50% LOWER than 1993 (with blue dot)" ] }, { "name": "Public Perception", "style": "dashed red line", "trend": "remains relatively flat and high", "annotations": [ "PUBLIC PERCEPTION: Remains High... (with red arrow pointing to line)", "2024 62% think crime is up (with red dot)" ] } ] }, "callout_box": { "position": "bottom left inside chart area", "style": "light yellow rectangle", "icon": "lightbulb", "text": "{argument name=\"callout text\" default=\"The crime rate and the public's feeling about crime have almost no relationship.\"}" }, "footer": { "text": "SOURCE: {argument name=\"footer source\" default=\"Bureau of Justice Statistics NCVS · FBI Uniform Crime Reports · Gallup Crime Poll\"}" } }
编辑级双轴数据信息图
zh-CN{ "type": "编辑级信息图双轴折线图", "style": "简洁、报纸风格、米白色背景、高可读性排版", "header": { "category": "犯罪、安全与司法(红色文字,配红色方形图标)", "headline": "{argument name=\"main headline\" default=\"自 1993 年以来,犯罪率下降了 50%。但大多数美国人认为犯罪率在上升。两者同时为真。\"}", "sub_headline": "美国暴力犯罪率 vs 公众感知 · 1990 年至今 · BJS/FBI + GALLUP" }, "chart": { "x_axis": "1990 年至 2024 年,共 8 个刻度", "left_y_axis": { "color": "蓝色", "label": "{argument name=\"left axis label\" default=\"每 10 万人的暴力犯罪率\"}", "range": "200 至 800" }, "right_y_axis": { "color": "红色", "label": "{argument name=\"right axis label\" default=\"认为‘犯罪率较去年上升’的美国人百分比\"}", "range": "20% 至 80%" }, "data_series": [ { "name": "现实情况", "style": "蓝色实线", "trend": "早期达到峰值后显著下降", "annotations": [ "1993 年峰值:每 10 万人中有 747 起暴力犯罪(带蓝色圆点)", "现实:犯罪率已下降(带指向线条的蓝色箭头)", "2024 年:每 10 万人中有 376 起,较 1993 年降低约 50%(带蓝色圆点)" ] }, { "name": "公众感知", "style": "红色虚线", "trend": "保持相对平稳且处于高位", "annotations": [ "公众感知:保持高位……(带指向线条的红色箭头)", "2024 年:62% 的人认为犯罪率在上升(带红色圆点)" ] } ] }, "callout_box": { "position": "图表区域内左下角", "style": "浅黄色矩形", "icon": "灯泡", "text": "{argument name=\"callout text\" default=\"犯罪率与公众对犯罪的感受之间几乎没有关联。\"}" }, "footer": { "text": "数据来源:{argument name=\"footer source\" default=\"司法统计局 NCVS · FBI 统一犯罪报告 · 盖洛普犯罪民调\"}" } }