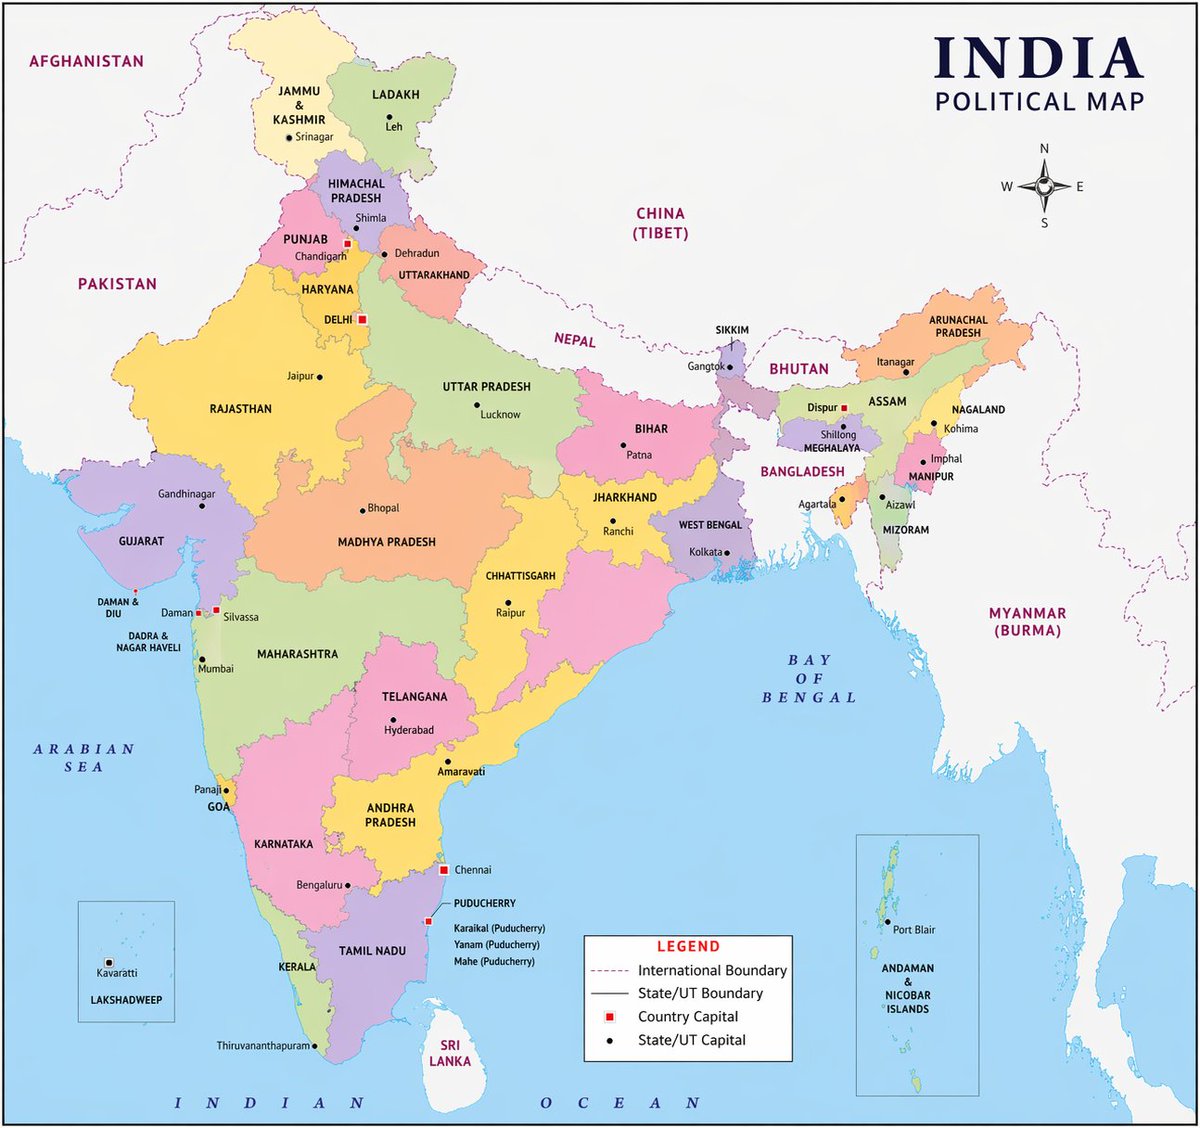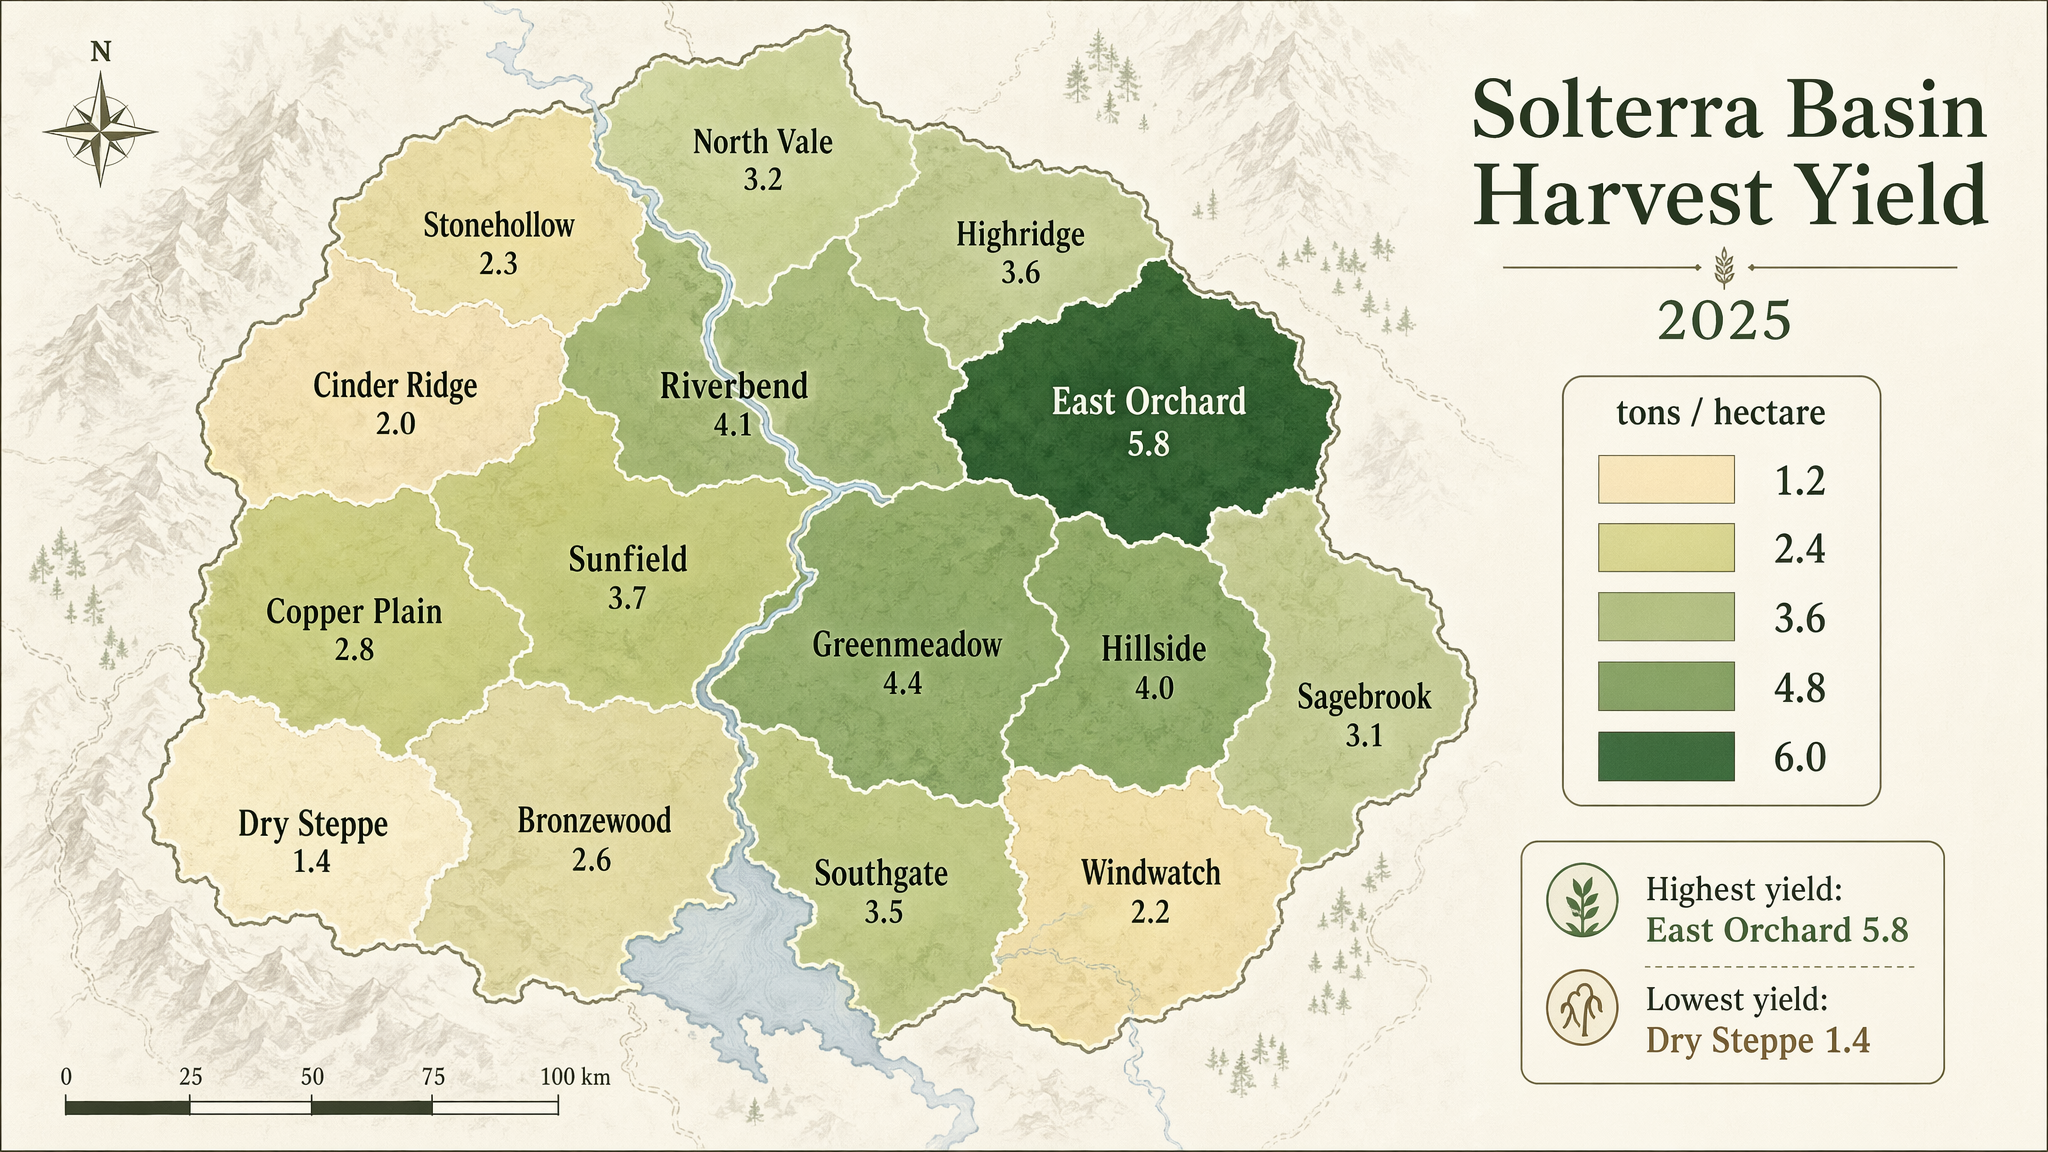
Geographic Choropleth Yield Map
Produce a polished geographic choropleth map infographic of a fictional agricultural region called the Solterra Basin, showing harvest yield by district. Use a minimalist cartograp
- Category
- Charts & Infographics
- Model
- GPT Image 2
- Creator
- wuyoscar
- Source language
- en
- Source ID
- 111
Full prompt
Produce a polished geographic choropleth map infographic of a fictional agricultural region called the Solterra Basin, showing harvest yield by district. Use a minimalist cartographic style on an off-white background with muted terrain hints and a sequential palette from pale sand to deep green. The map should include 14 clearly separated districts with clean borders, crisp labels, and a right-side legend. Include in-image text: "Solterra Basin Harvest Yield", "2025", and legend title "tons / hectare". Label districts with names such as "North Vale", "Riverbend", "Copper Plain", "East Orchard", and "Cinder Ridge". Include legend values "1.2", "2.4", "3.6", "4.8", and "6.0". Add a compact annotation box reading "Highest yield: East Orchard 5.8" and "Lowest yield: Dry Steppe 1.4". Prioritize clean typography, accurate map-like geometry, balanced composition, subtle cartographic detail, and publication-grade infographic clarity.
Translations
Geographic Choropleth Yield Map
enProduce a polished geographic choropleth map infographic of a fictional agricultural region called the Solterra Basin, showing harvest yield by district. Use a minimalist cartographic style on an off-white background with muted terrain hints and a sequential palette from pale sand to deep green. The map should include 14 clearly separated districts with clean borders, crisp labels, and a right-side legend. Include in-image text: "Solterra Basin Harvest Yield", "2025", and legend title "tons / hectare". Label districts with names such as "North Vale", "Riverbend", "Copper Plain", "East Orchard", and "Cinder Ridge". Include legend values "1.2", "2.4", "3.6", "4.8", and "6.0". Add a compact annotation box reading "Highest yield: East Orchard 5.8" and "Lowest yield: Dry Steppe 1.4". Prioritize clean typography, accurate map-like geometry, balanced composition, subtle cartographic detail, and publication-grade infographic clarity.