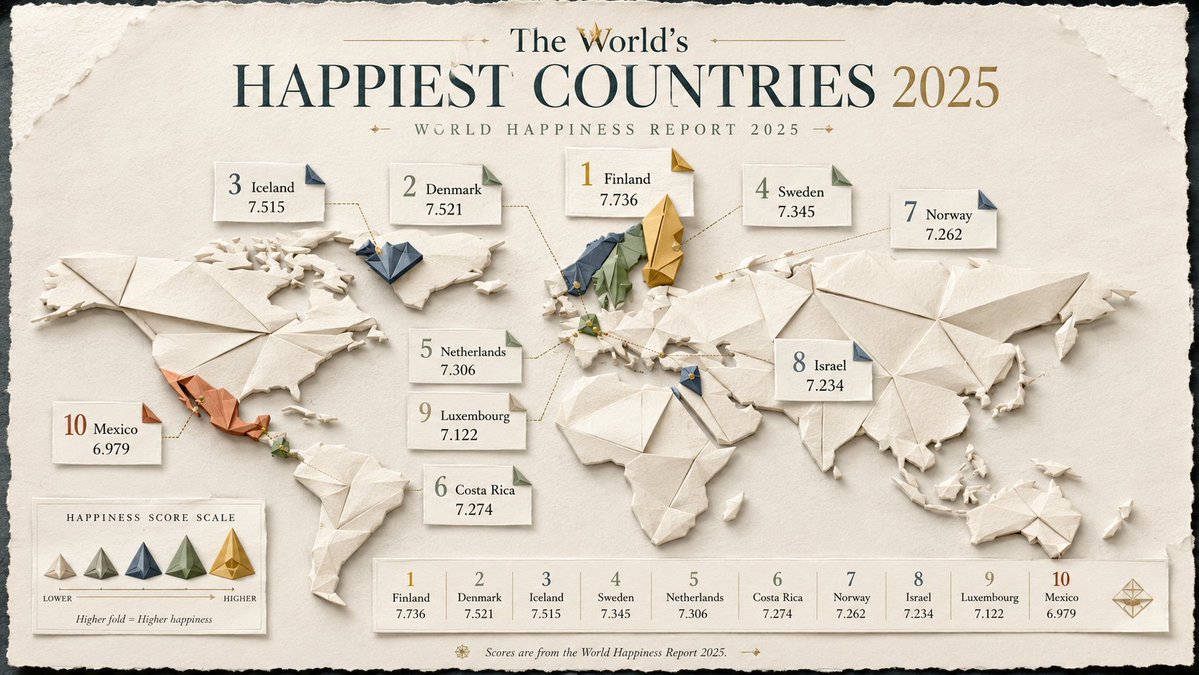
折纸风格全球信息图
一套复杂的指令集,用于创作具有“静奢风”杂志美感、基于研究数据集的触感折纸风格信息图。
- Category
- Charts & Infographics
- Model
- GPT Image 2
- Creator
- Gadgetify
- Source language
- en
- Source ID
- 21669
- Published
- May 20, 2026
Full prompt
(researched {argument name="dataset type" default="geopolitical or global dataset"} × {argument name="map style" default="elegant folded-paper cartography"}) + (origami sculpture ^ editorial information design ^ soft tactile shading) - (flat boring map + fake country data + corporate dashboard aesthetic) = viral folded-world infographic INPUT: {argument name="topic" default="Countries with the fastest internet speeds"} SYSTEM: Research the input topic and create a premium infographic built around a stylized world or regional map made from layered origami paper forms. RESEARCH REQUIREMENTS: - Research the correct ranking or comparison data for the topic. - Verify country names, numerical values, and year/date. - Use authoritative international or official sources where possible. - Do not invent values, ranks, or map classifications. - Keep metric definitions consistent across all countries. VISUAL CONCEPT: Turn the data into an elegant folded-paper map or collection of origami country tiles. Use folds, shadows, tabs, and layered paper shapes to encode hierarchy, rank, or magnitude. STYLE: origami editorial infographic, layered paper map, tactile folds, premium magazine design, quiet luxury information art COMPOSITION: - strong title at top - world map or region map as the main visual - top countries highlighted with larger folded structures - small callout cards with: country name value rank year - subtle legend if needed - use visual hierarchy through size, folds, and elevation - minimal but readable labels MATERIALS: matte paper, embossed card, soft deckled edges, cream and muted color palette, subtle drop shadows OUTPUT: Research the topic, verify the dataset, then generate a polished origami-style global infographic that feels tactile, elegant, and highly shareable.Translations
折纸风格全球信息图
en(researched {argument name="dataset type" default="geopolitical or global dataset"} × {argument name="map style" default="elegant folded-paper cartography"}) + (origami sculpture ^ editorial information design ^ soft tactile shading) - (flat boring map + fake country data + corporate dashboard aesthetic) = viral folded-world infographic INPUT: {argument name="topic" default="Countries with the fastest internet speeds"} SYSTEM: Research the input topic and create a premium infographic built around a stylized world or regional map made from layered origami paper forms. RESEARCH REQUIREMENTS: - Research the correct ranking or comparison data for the topic. - Verify country names, numerical values, and year/date. - Use authoritative international or official sources where possible. - Do not invent values, ranks, or map classifications. - Keep metric definitions consistent across all countries. VISUAL CONCEPT: Turn the data into an elegant folded-paper map or collection of origami country tiles. Use folds, shadows, tabs, and layered paper shapes to encode hierarchy, rank, or magnitude. STYLE: origami editorial infographic, layered paper map, tactile folds, premium magazine design, quiet luxury information art COMPOSITION: - strong title at top - world map or region map as the main visual - top countries highlighted with larger folded structures - small callout cards with: country name value rank year - subtle legend if needed - use visual hierarchy through size, folds, and elevation - minimal but readable labels MATERIALS: matte paper, embossed card, soft deckled edges, cream and muted color palette, subtle drop shadows OUTPUT: Research the topic, verify the dataset, then generate a polished origami-style global infographic that feels tactile, elegant, and highly shareable.
折纸风格全球信息图
zh-CN(研究 {argument name="dataset type" default="地缘政治或全球数据集"} × {argument name="map style" default="优雅的折纸地图制图"}) + (折纸雕塑 ^ 编辑信息设计 ^ 柔和的触感阴影) - (平面枯燥的地图 + 虚假国家数据 + 企业仪表盘美学) = 病毒式传播的折纸世界信息图 输入:{argument name="topic" default="网速最快的国家"} 系统:研究输入的主题,并围绕由层叠折纸形式构成的风格化世界地图或区域地图,创作一张高级信息图。 研究要求: - 研究该主题准确的排名或对比数据。 - 核实国家名称、数值以及年份/日期。 - 尽可能使用权威的国际或官方来源。 - 请勿虚构数值、排名或地图分类。 - 确保各国的指标定义保持一致。 视觉概念:将数据转化为优雅的折纸地图或折纸国家板块集合。利用折痕、阴影、标签和层叠的纸张形状来编码层级、排名或量级。 风格:折纸编辑信息图、层叠纸质地图、触感折痕、高级杂志设计、静奢风信息艺术 构图: - 顶部设有醒目的标题 - 以世界地图或区域地图作为主要视觉元素 - 突出显示排名靠前的国家,并使用更大的折叠结构 - 带有以下内容的小型标注卡片: 国家名称 数值 排名 年份 - 必要时添加简洁的图例 - 通过尺寸、折痕和高度差体现视觉层级 - 标签简洁且易读 材质:哑光纸、压纹卡纸、柔和的毛边、奶油色与柔和的色调、细腻的投影 输出:研究主题,核实数据集,然后生成一张精致的折纸风格全球信息图,使其具有触感、优雅且极具传播价值。