信息图可视化设计
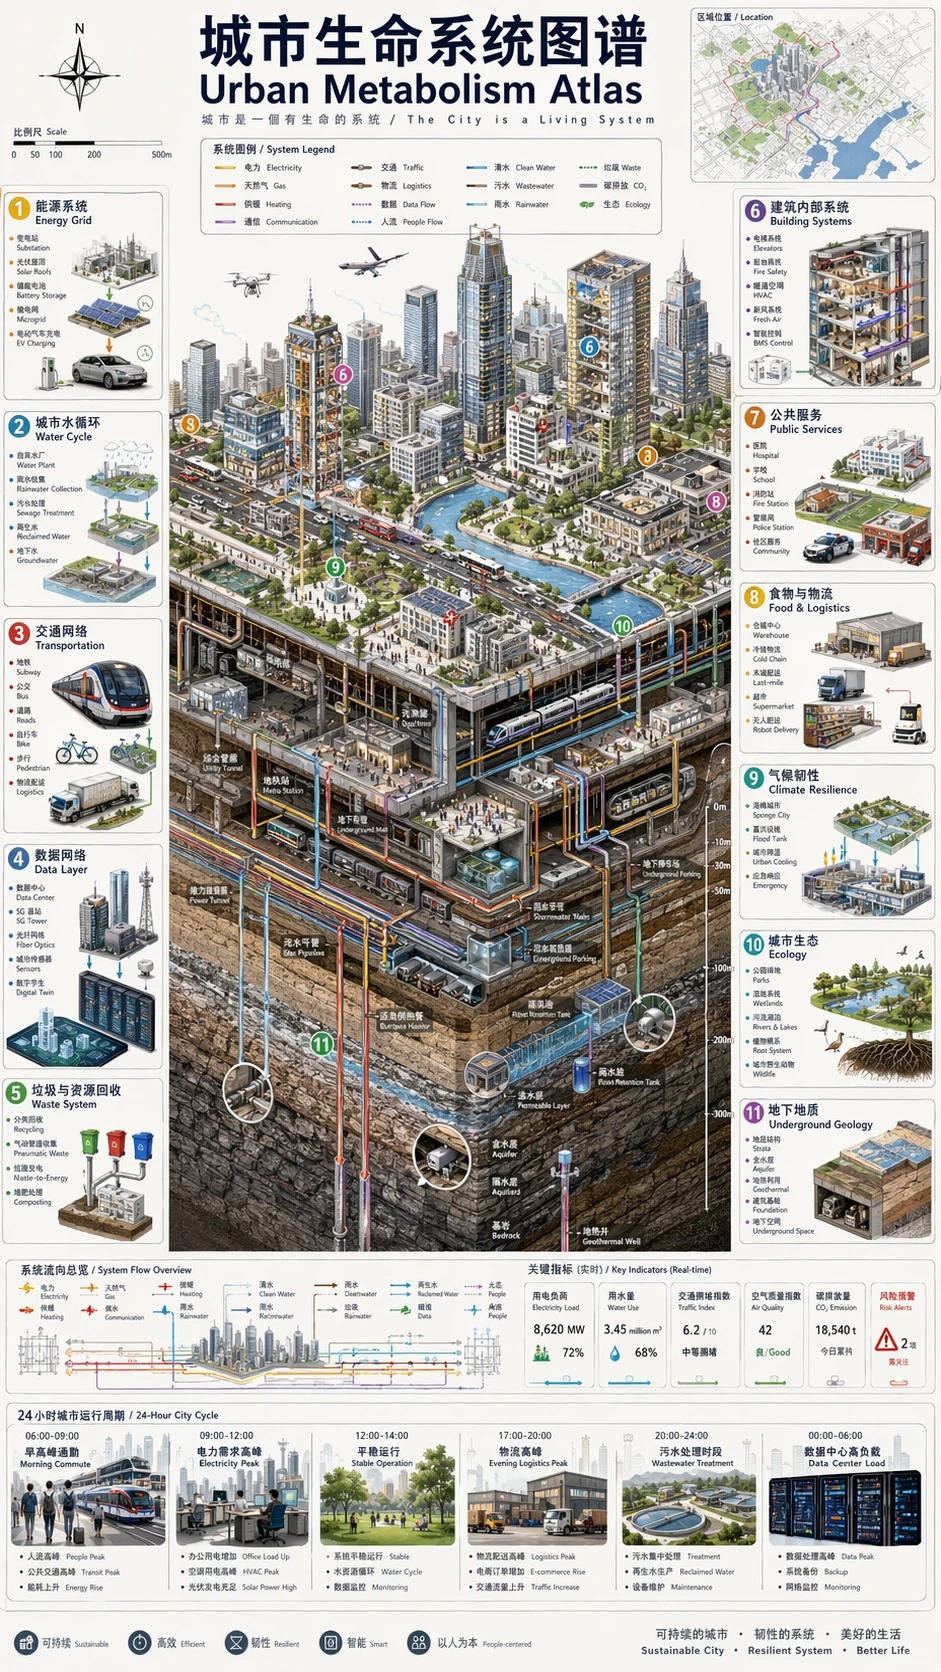
Vertical 9:16 isometric cutaway infographic "城市生命系统图谱 / Urban Metabolism Atlas". Smart city from sky to bedrock: skyscrapers, streets, subway, utility tunnels, water/sewage/gas/heating pipes, fiber, data center, flood ta
- 分类
- UI 与界面
- 模型
- GPT Image 2
- 来源作者
- freestylefly
- 原始语言
- en
- 来源 ID
- 1
完整提示词
Vertical 9:16 isometric cutaway infographic "城市生命系统图谱 / Urban Metabolism Atlas". Smart city from sky to bedrock: skyscrapers, streets, subway, utility tunnels, water/sewage/gas/heating pipes, fiber, data center, flood tanks, aquifers, geothermal wells, bedrock. Color-coded flows for power/water/data/traffic/waste. 12 numbered panels bilingual CN/EN: 能源/水循环/交通/数据/垃圾/建筑/公共服务/ 物流/气候韧性/生态/地质/治理看板. 24h timeline at bottom. Style: engineering white paper + scientific atlas, light paper bg, crisp lines, 8K. No cyberpunk, no gibberish text, must show both above AND below ground.
多语言版本
信息图可视化设计
enVertical 9:16 isometric cutaway infographic "城市生命系统图谱 / Urban Metabolism Atlas". Smart city from sky to bedrock: skyscrapers, streets, subway, utility tunnels, water/sewage/gas/heating pipes, fiber, data center, flood tanks, aquifers, geothermal wells, bedrock. Color-coded flows for power/water/data/traffic/waste. 12 numbered panels bilingual CN/EN: 能源/水循环/交通/数据/垃圾/建筑/公共服务/ 物流/气候韧性/生态/地质/治理看板. 24h timeline at bottom. Style: engineering white paper + scientific atlas, light paper bg, crisp lines, 8K. No cyberpunk, no gibberish text, must show both above AND below ground.