Weather Systems Diagram
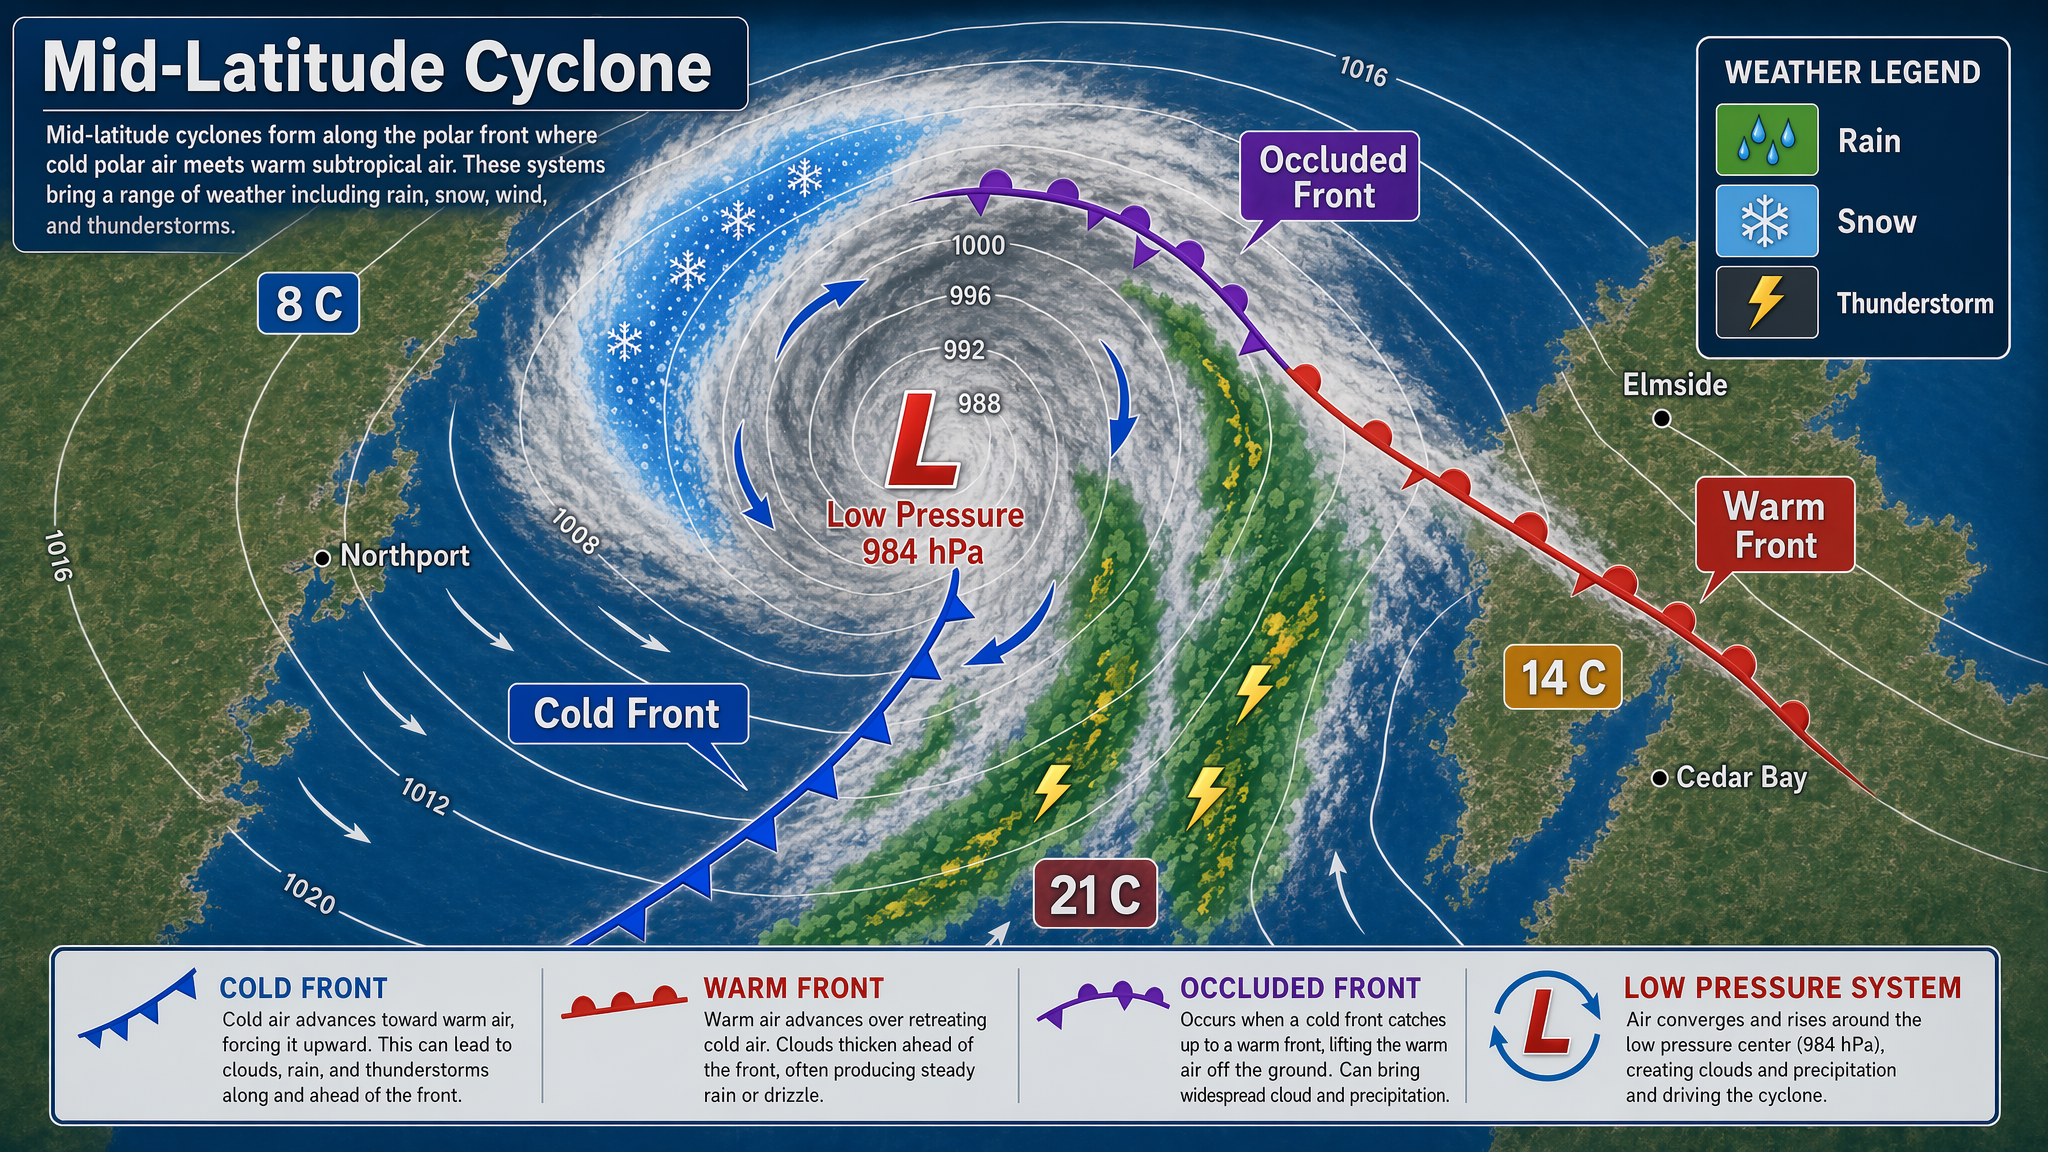
Create a polished meteorology infographic showing a mid-latitude cyclone system from a top-down synoptic view. Use a cool palette of ocean blue, cloud white, storm gray, crimson, a
- 分类
- 图表信息图
- 模型
- GPT Image 2
- 来源作者
- wuyoscar
- 原始语言
- en
- 来源 ID
- 127
完整提示词
Create a polished meteorology infographic showing a mid-latitude cyclone system from a top-down synoptic view. Use a cool palette of ocean blue, cloud white, storm gray, crimson, and cobalt, with smooth contour lines and crisp symbols. Include pressure isobars, cloud bands, warm and cold fronts, arrows for wind direction, and rainfall zones. Add clear in-image text: "Mid-Latitude Cyclone", "Low Pressure 984 hPa", "Warm Front", "Cold Front", and "Occluded Front". Include city labels "Northport", "Elmside", and "Cedar Bay" for context, plus a legend reading "Rain", "Snow", and "Thunderstorm". Show temperature markers "8 C", "14 C", and "21 C" in different air masses. The composition should be educational and publication-ready, with sharp labels, clean hierarchy, accurate diagram conventions, and strong visual readability suitable for a textbook or science exhibit panel.
多语言版本
Weather Systems Diagram
enCreate a polished meteorology infographic showing a mid-latitude cyclone system from a top-down synoptic view. Use a cool palette of ocean blue, cloud white, storm gray, crimson, and cobalt, with smooth contour lines and crisp symbols. Include pressure isobars, cloud bands, warm and cold fronts, arrows for wind direction, and rainfall zones. Add clear in-image text: "Mid-Latitude Cyclone", "Low Pressure 984 hPa", "Warm Front", "Cold Front", and "Occluded Front". Include city labels "Northport", "Elmside", and "Cedar Bay" for context, plus a legend reading "Rain", "Snow", and "Thunderstorm". Show temperature markers "8 C", "14 C", and "21 C" in different air masses. The composition should be educational and publication-ready, with sharp labels, clean hierarchy, accurate diagram conventions, and strong visual readability suitable for a textbook or science exhibit panel.