NOVALITH SaaS 演示文稿网格
为虚构的数据预测平台生成一套精致的 3x3 日本 B2B SaaS 演示文稿概览。
- Category
- Charts & Infographics
- Model
- GPT Image 2
- Creator
- Masao.N
- Source language
- en
- Source ID
- 20107
- Published
- May 13, 2026
Full prompt
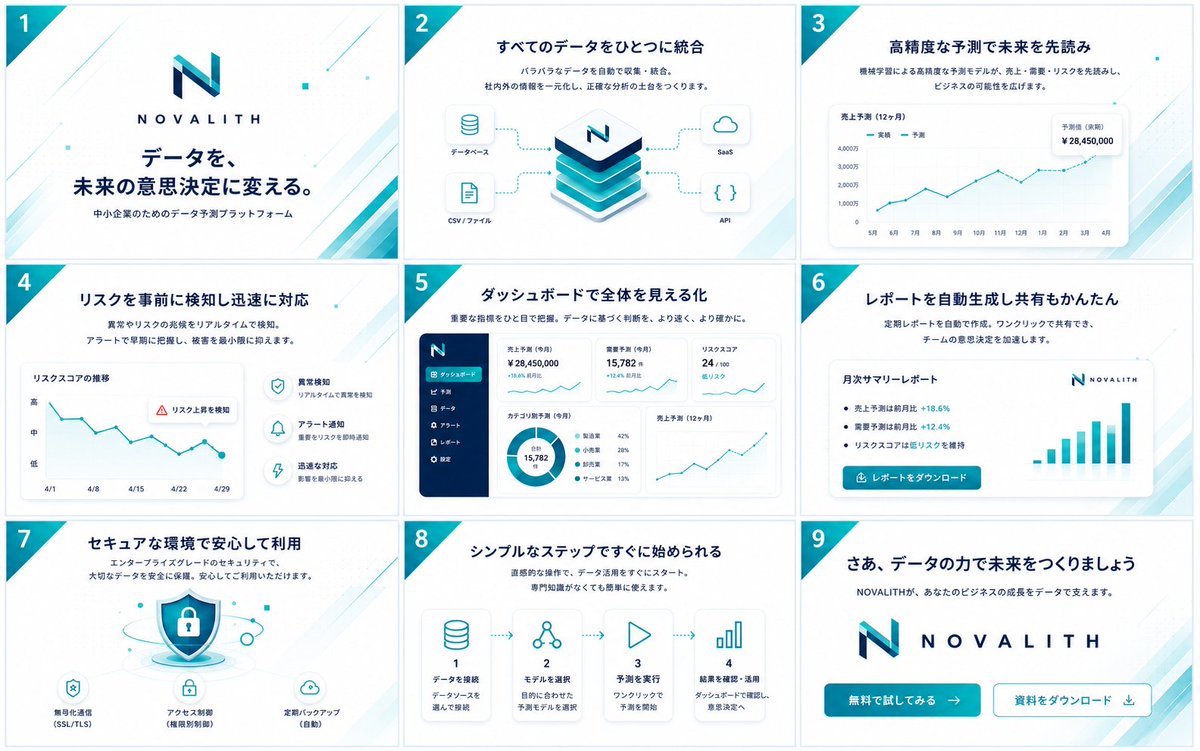
Goal: Create a clean, high-end Japanese B2B SaaS pitch deck / service concept board for {argument name="service name" default="NOVALITH"}, showing exactly 9 widescreen slides arranged in a 3 by 3 grid as if previewing an LP, mobile top, banner, and presentation materials.
Canvas: One landscape image containing 9 separate 16:9 slide thumbnails, evenly spaced with thin pale borders. White background, navy and teal corporate palette, light cyan diagonal line accents, subtle geometric dots, and a teal triangular corner ribbon on the upper-left of every slide containing the slide number 1 through 9 in white.
Visual style: Modern Japanese startup / enterprise SaaS design, polished vector UI, minimal gradients, soft shadows, rounded cards, thin teal data lines, navy headings, plenty of whitespace. Use a stylized geometric N logo in teal and navy, with spaced uppercase wordmark {argument name="service name" default="NOVALITH"}. No people or photos; use only icons, charts, dashboards, and abstract product visuals.
Text language: All visible slide copy should be in Japanese. Use crisp, presentation-ready typography with bold navy headlines and smaller explanatory subtext.
Slide count and layout details: Include exactly 9 slides:
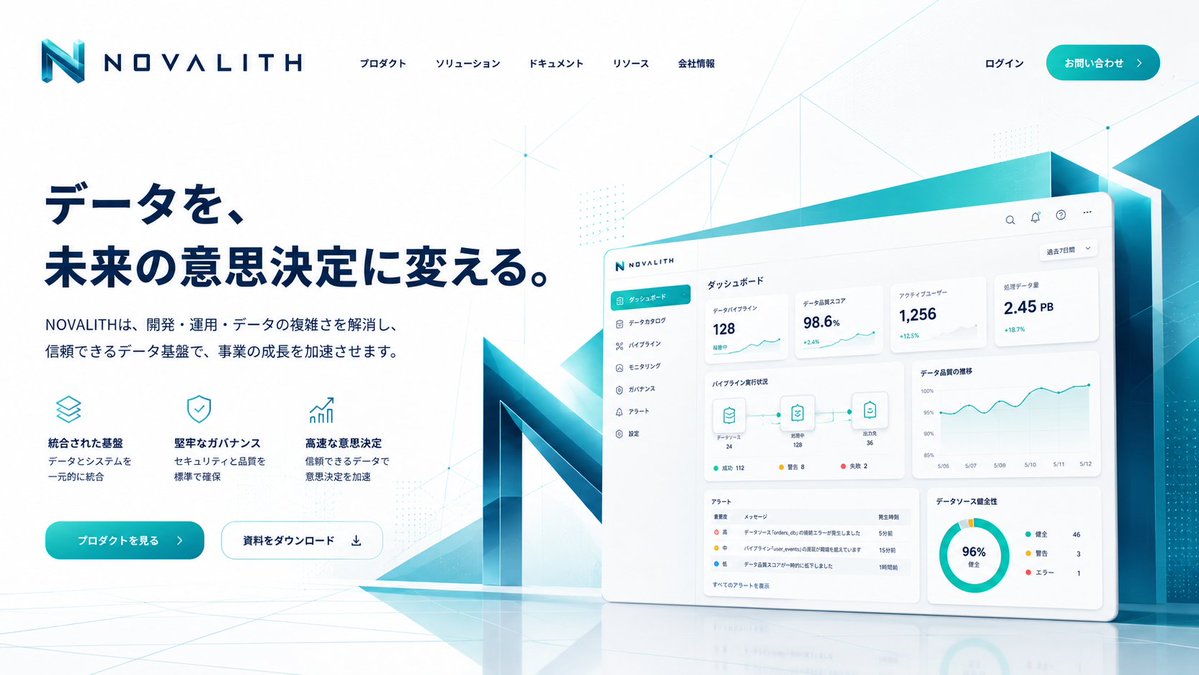
1. Cover slide. Large NOVALITH logo centered above the headline 「データを、未来の意思決定に変える。」 and subheading 「中小企業のためのデータ予測プラットフォーム」. Decorative teal diagonal accents in the corners.
2. Data integration slide. Headline 「すべてのデータをひとつに統合」 with short subtext about automatically collecting and integrating scattered data. Center shows a stacked isometric database/platform cube with the N logo on top. Four connected input/output cards: 「データベース」, 「CSV / ファイル」, 「SaaS」, 「API」.
3. Forecasting slide. Headline 「高精度な予測で未来を先読み」. Large line chart card titled 「売上予測(12ヶ月)」 with legend 「実績」 and 「予測」, months along the x-axis, an upward teal trend line, and a floating KPI card reading 「予測値(来期)¥28,450,000」.
4. Risk detection slide. Headline 「リスクを事前に検知し迅速に対応」. Left chart card titled 「リスクスコアの推移」 showing a declining zigzag teal line with dates 4/1 to 4/29 and y-axis levels 高, 中, 低. Add a warning callout 「リスク上昇を検知」. Right side has exactly 3 feature rows with circular icons: anomaly detection, alert notification, and rapid response.
5. Dashboard slide. Headline 「ダッシュボードで全体を見える化」. Show a full SaaS dashboard screenshot: dark navy left sidebar with logo and exactly 6 menu items, and a main area with KPI cards, a donut chart, and a sales forecast line chart. Visible KPI examples include 「売上予測(今月)¥28,450,000」, 「需要予測(今月)15,782」, and 「リスクスコア 24/100」.
6. Automated report slide. Headline 「レポートを自動生成し共有もかんたん」. Center a white report card titled 「月次サマリーレポート」 with bullet points showing positive percentages such as +18.6% and +12.4%, a NOVALITH logo in the corner, a teal bar chart on the right, and a teal button labeled 「レポートをダウンロード」.
7. Security slide. Headline 「セキュアな環境で安心して利用」. Central shield-and-padlock illustration with floating security particles. Bottom has exactly 3 security feature icons and labels: 「暗号化通信(SSL/TLS)」, 「アクセス制御(権限分割)」, and 「定期バックアップ(自動)」.
8. Simple steps slide. Headline 「シンプルなステップですぐに始められる」. Show exactly 4 horizontally connected step cards with dotted arrows: step 1 database icon 「データを接続」, step 2 node/network icon 「モデルを選択」, step 3 play icon 「予測を実行」, step 4 bar-chart icon 「結果を確認・活用」. Each card includes a short explanatory line underneath.
9. Closing CTA slide. Headline 「さあ、データの力で未来をつくりましょう」 with subtext 「NOVALITHが、あなたのビジネスの成長をデータで支えます。」. Large centered logo and wordmark. Bottom has exactly 2 call-to-action buttons: filled teal button 「無料で試してみる →」 and outlined button 「資料をダウンロード ↓」.
Constraints: Maintain consistent brand colors, logo, spacing, slide numbering, and diagonal teal corner motif across all 9 slides. The overall image should look like a single polished overview sheet of presentation thumbnails, not isolated full-screen slides. Avoid extra slides, extra buttons, stock photos, watermarks, or unrelated text.Translations
NOVALITH SaaS 演示文稿网格
enGoal: Create a clean, high-end Japanese B2B SaaS pitch deck / service concept board for {argument name="service name" default="NOVALITH"}, showing exactly 9 widescreen slides arranged in a 3 by 3 grid as if previewing an LP, mobile top, banner, and presentation materials. Canvas: One landscape image containing 9 separate 16:9 slide thumbnails, evenly spaced with thin pale borders. White background, navy and teal corporate palette, light cyan diagonal line accents, subtle geometric dots, and a teal triangular corner ribbon on the upper-left of every slide containing the slide number 1 through 9 in white. Visual style: Modern Japanese startup / enterprise SaaS design, polished vector UI, minimal gradients, soft shadows, rounded cards, thin teal data lines, navy headings, plenty of whitespace. Use a stylized geometric N logo in teal and navy, with spaced uppercase wordmark {argument name="service name" default="NOVALITH"}. No people or photos; use only icons, charts, dashboards, and abstract product visuals. Text language: All visible slide copy should be in Japanese. Use crisp, presentation-ready typography with bold navy headlines and smaller explanatory subtext. Slide count and layout details: Include exactly 9 slides: 1. Cover slide. Large NOVALITH logo centered above the headline 「データを、未来の意思決定に変える。」 and subheading 「中小企業のためのデータ予測プラットフォーム」. Decorative teal diagonal accents in the corners. 2. Data integration slide. Headline 「すべてのデータをひとつに統合」 with short subtext about automatically collecting and integrating scattered data. Center shows a stacked isometric database/platform cube with the N logo on top. Four connected input/output cards: 「データベース」, 「CSV / ファイル」, 「SaaS」, 「API」. 3. Forecasting slide. Headline 「高精度な予測で未来を先読み」. Large line chart card titled 「売上予測(12ヶ月)」 with legend 「実績」 and 「予測」, months along the x-axis, an upward teal trend line, and a floating KPI card reading 「予測値(来期)¥28,450,000」. 4. Risk detection slide. Headline 「リスクを事前に検知し迅速に対応」. Left chart card titled 「リスクスコアの推移」 showing a declining zigzag teal line with dates 4/1 to 4/29 and y-axis levels 高, 中, 低. Add a warning callout 「リスク上昇を検知」. Right side has exactly 3 feature rows with circular icons: anomaly detection, alert notification, and rapid response. 5. Dashboard slide. Headline 「ダッシュボードで全体を見える化」. Show a full SaaS dashboard screenshot: dark navy left sidebar with logo and exactly 6 menu items, and a main area with KPI cards, a donut chart, and a sales forecast line chart. Visible KPI examples include 「売上予測(今月)¥28,450,000」, 「需要予測(今月)15,782」, and 「リスクスコア 24/100」. 6. Automated report slide. Headline 「レポートを自動生成し共有もかんたん」. Center a white report card titled 「月次サマリーレポート」 with bullet points showing positive percentages such as +18.6% and +12.4%, a NOVALITH logo in the corner, a teal bar chart on the right, and a teal button labeled 「レポートをダウンロード」. 7. Security slide. Headline 「セキュアな環境で安心して利用」. Central shield-and-padlock illustration with floating security particles. Bottom has exactly 3 security feature icons and labels: 「暗号化通信(SSL/TLS)」, 「アクセス制御(権限分割)」, and 「定期バックアップ(自動)」. 8. Simple steps slide. Headline 「シンプルなステップですぐに始められる」. Show exactly 4 horizontally connected step cards with dotted arrows: step 1 database icon 「データを接続」, step 2 node/network icon 「モデルを選択」, step 3 play icon 「予測を実行」, step 4 bar-chart icon 「結果を確認・活用」. Each card includes a short explanatory line underneath. 9. Closing CTA slide. Headline 「さあ、データの力で未来をつくりましょう」 with subtext 「NOVALITHが、あなたのビジネスの成長をデータで支えます。」. Large centered logo and wordmark. Bottom has exactly 2 call-to-action buttons: filled teal button 「無料で試してみる →」 and outlined button 「資料をダウンロード ↓」. Constraints: Maintain consistent brand colors, logo, spacing, slide numbering, and diagonal teal corner motif across all 9 slides. The overall image should look like a single polished overview sheet of presentation thumbnails, not isolated full-screen slides. Avoid extra slides, extra buttons, stock photos, watermarks, or unrelated text.
NOVALITH SaaS 演示文稿网格
zh-CN目标:为 {argument name="service name" default="NOVALITH"} 创建一个简洁、高端的日本 B2B SaaS 演示文稿 / 服务概念项目,展示 9 张宽屏 Slides,以 3x3 网格形式排列,如同预览 LP、移动端顶部、横幅和演示材料。 画布:一张包含 9 张独立 16:9 Slide 缩略图的横向图像,缩略图之间间隔均匀,带有细浅色边框。白色背景,采用海军蓝和青色企业配色,配有浅青色对角线装饰、精致的几何点阵,每张 Slide 的左上角均有一个青色三角形边角丝带,内含白色的 Slide 编号 1 至 9。 视觉风格:现代日本初创企业 / 企业级 SaaS 设计,精致的矢量 UI,极简渐变,柔和阴影,圆角卡片,细青色数据线,海军蓝标题,留白充足。使用青色和海军蓝的几何 N 标识,搭配间距适中的大写字标 {argument name="service name" default="NOVALITH"}。不包含人物或照片;仅使用图标、图表、仪表盘和抽象的产品视觉元素。 文本语言:所有可见的 Slide 文案均应为日语。使用清晰、适合演示的排版,搭配粗体海军蓝标题和较小的解释性副标题。 Slide 数量及布局细节:包含 9 张 Slide: 1. 封面 Slide。大型 NOVALITH 标识居中,上方为标题「データを、未来の意思決定に変える。」及副标题「中小企業のためのデータ予測プラットフォーム」。角落有装饰性青色对角线。 2. 数据集成 Slide。标题「すべてのデータをひとつに統合」,配有关于自动收集和整合分散数据的简短副标题。中心展示一个堆叠的等距数据库/平台立方体,顶部带有 N 标识。四个连接的输入/输出卡片:「データベース」、「CSV / ファイル」、「SaaS」、「API」。 3. 预测 Slide。标题「高精度な予測で未来を先読み」。大型折线图卡片,标题为「売上予測(12ヶ月)」,图例为「実績」和「予測」,X 轴为月份,配有向上的青色趋势线,以及一个浮动 KPI 卡片,显示「予測値(来期)¥28,450,000」。 4. 风险检测 Slide。标题「リスクを事前に検知し迅速に対応」。左侧图表卡片标题为「リスクスコアの推移」,显示一条下降的之字形青色折线,日期为 4/1 至 4/29,Y 轴级别为高、中、低。添加警告标注「リスク上昇を検知」。右侧有 3 行带有圆形图标的功能说明:异常检测、警报通知和快速响应。 5. 仪表盘 Slide。标题「ダッシュボードで全体を見える化」。展示一个完整的 SaaS 仪表盘截图:深海军蓝左侧边栏包含标识和 6 个菜单项,主区域包含 KPI 卡片、圆环图和销售预测折线图。可见的 KPI 示例包括「売上予測(今月)¥28,450,000」、「需要予測(今月)15,782」和「リスクスコア 24/100」。 6. 自动报告 Slide。标题「レポートを自動生成し共有もかんたん」。中心为一个白色报告卡片,标题为「月次サマリーレポート」,项目符号显示正百分比(如 +18.6% 和 +12.4%),角落有 NOVALITH 标识,右侧有青色柱状图,以及一个标有「レポートをダウンロード」的青色按钮。 7. 安全性 Slide。标题「セキュアな環境で安心して利用」。中心为盾牌和挂锁插图,周围有浮动的安全粒子。底部有 3 个安全功能图标及标签:「暗号化通信(SSL/TLS)」、「アクセス制御(権限分割)」和「定期バックアップ(自動)」。 8. 简单步骤 Slide。标题「シンプルなステップですぐに始められる」。展示 4 个水平连接的步骤卡片,带有虚线箭头:步骤 1 数据库图标「データを接続」、步骤 2 节点/网络图标「モデルを選択」、步骤 3 播放图标「予測を実行」、步骤 4 柱状图图标「結果を確認・活用」。每张卡片下方均包含一行简短的解释说明。 9. 结束语 CTA Slide。标题「さあ、データの力で未来をつくりましょう」,副标题「NOVALITHが、あなたのビジネスの成長をデータで支えます。」。大型居中标识和字标。底部有 2 个行动号召按钮:填充式青色按钮「無料で試してみる →」和轮廓式按钮「資料をダウンロード ↓」。 约束:在所有 9 张 Slide 中保持一致的品牌颜色、标识、间距、Slide 编号和青色对角线边角主题。整体图像应看起来像一张精致的演示缩略图概览表,而非孤立的全屏 Slide。避免出现多余的 Slide、多余的按钮、库存照片、水印或无关文本。