图表信息图OpenAIcharts-infographics
Academic Poster
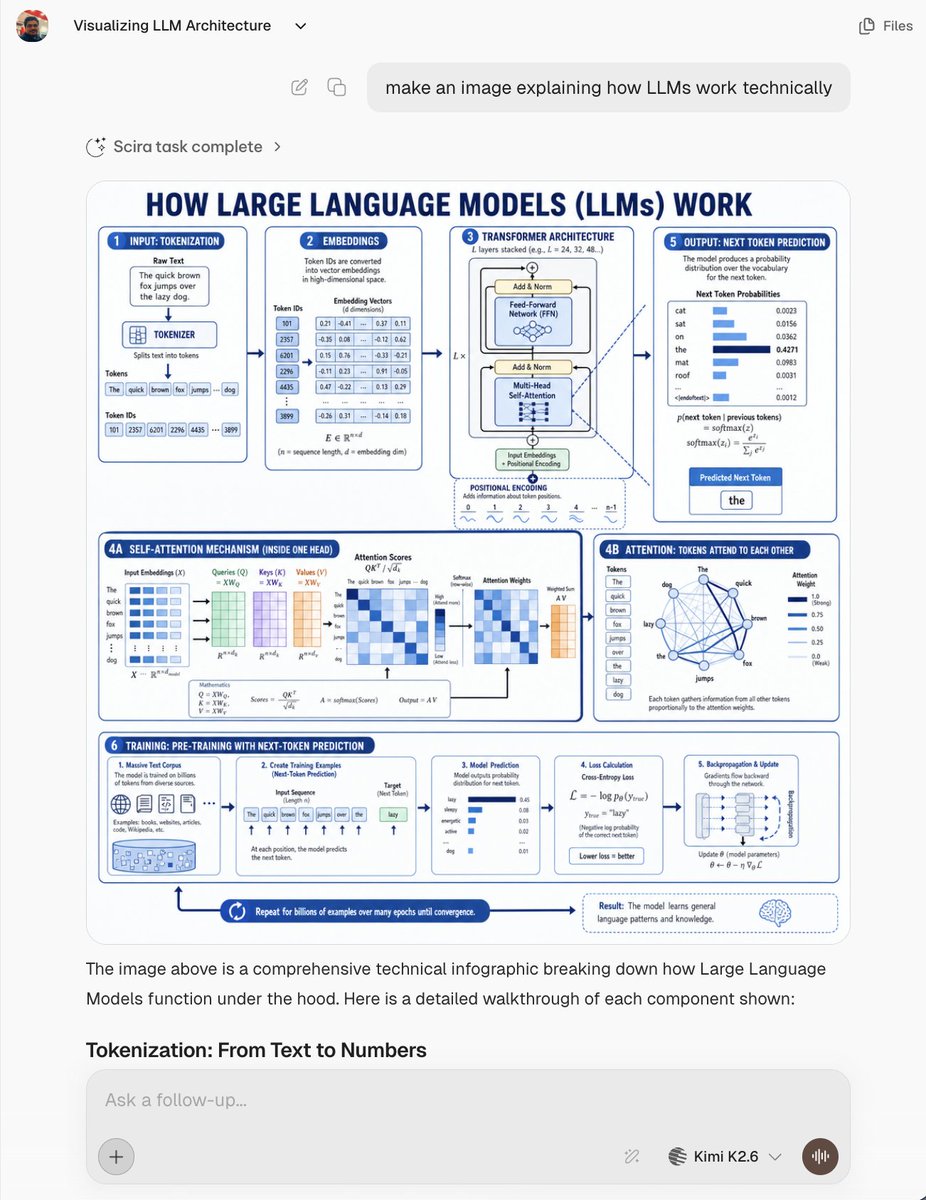
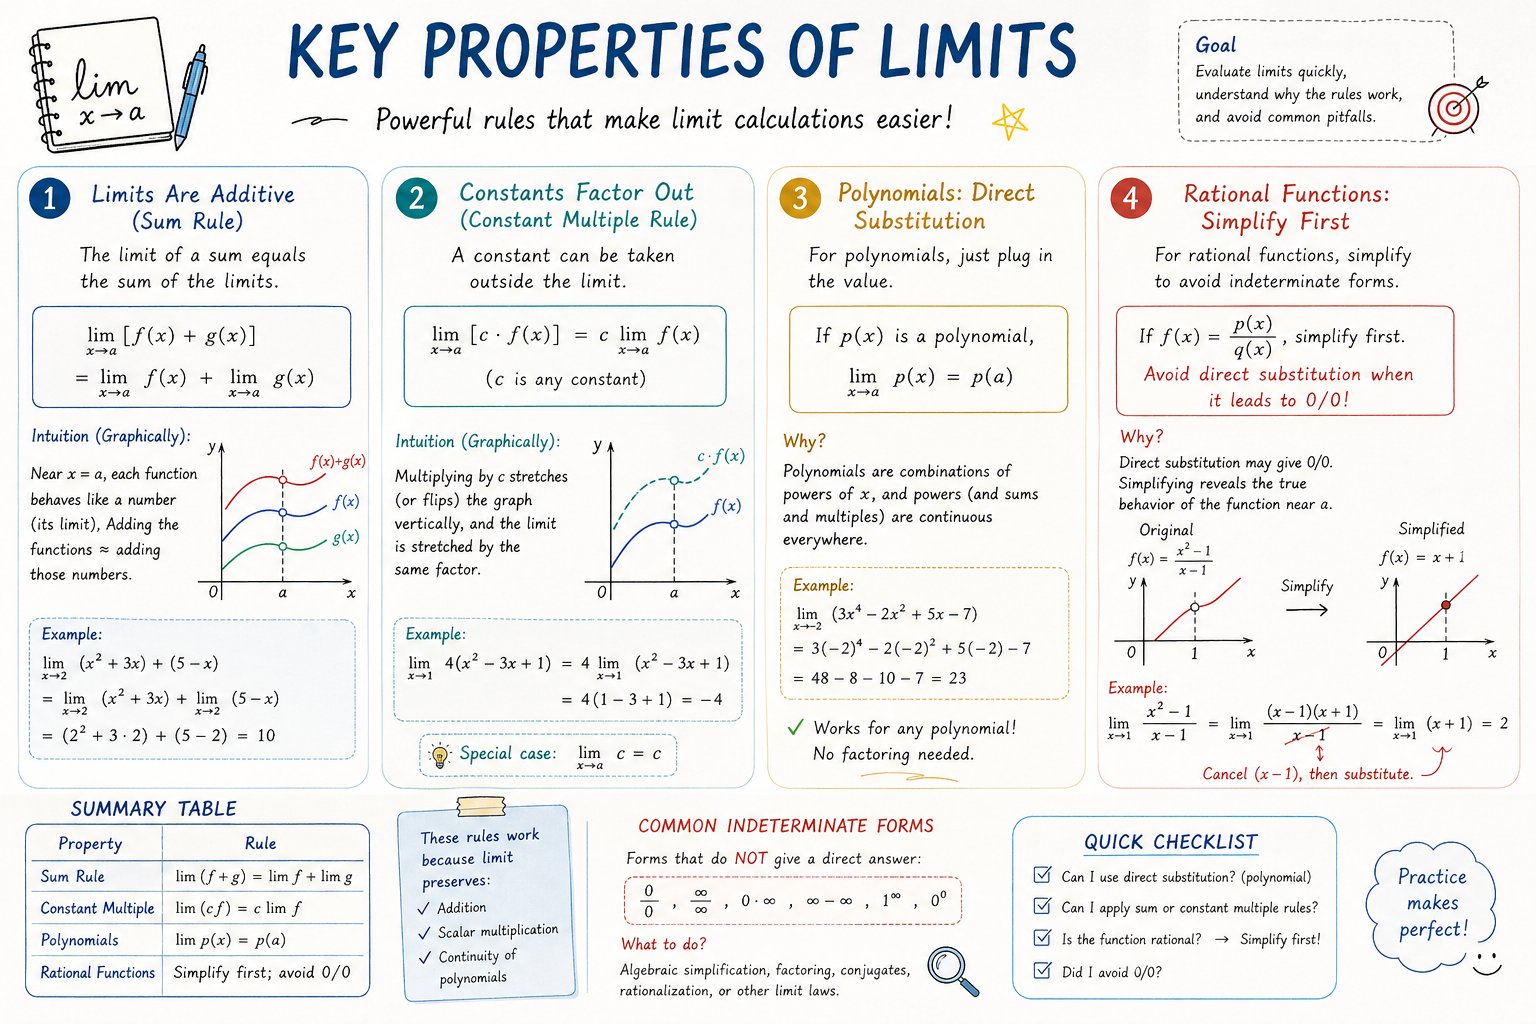
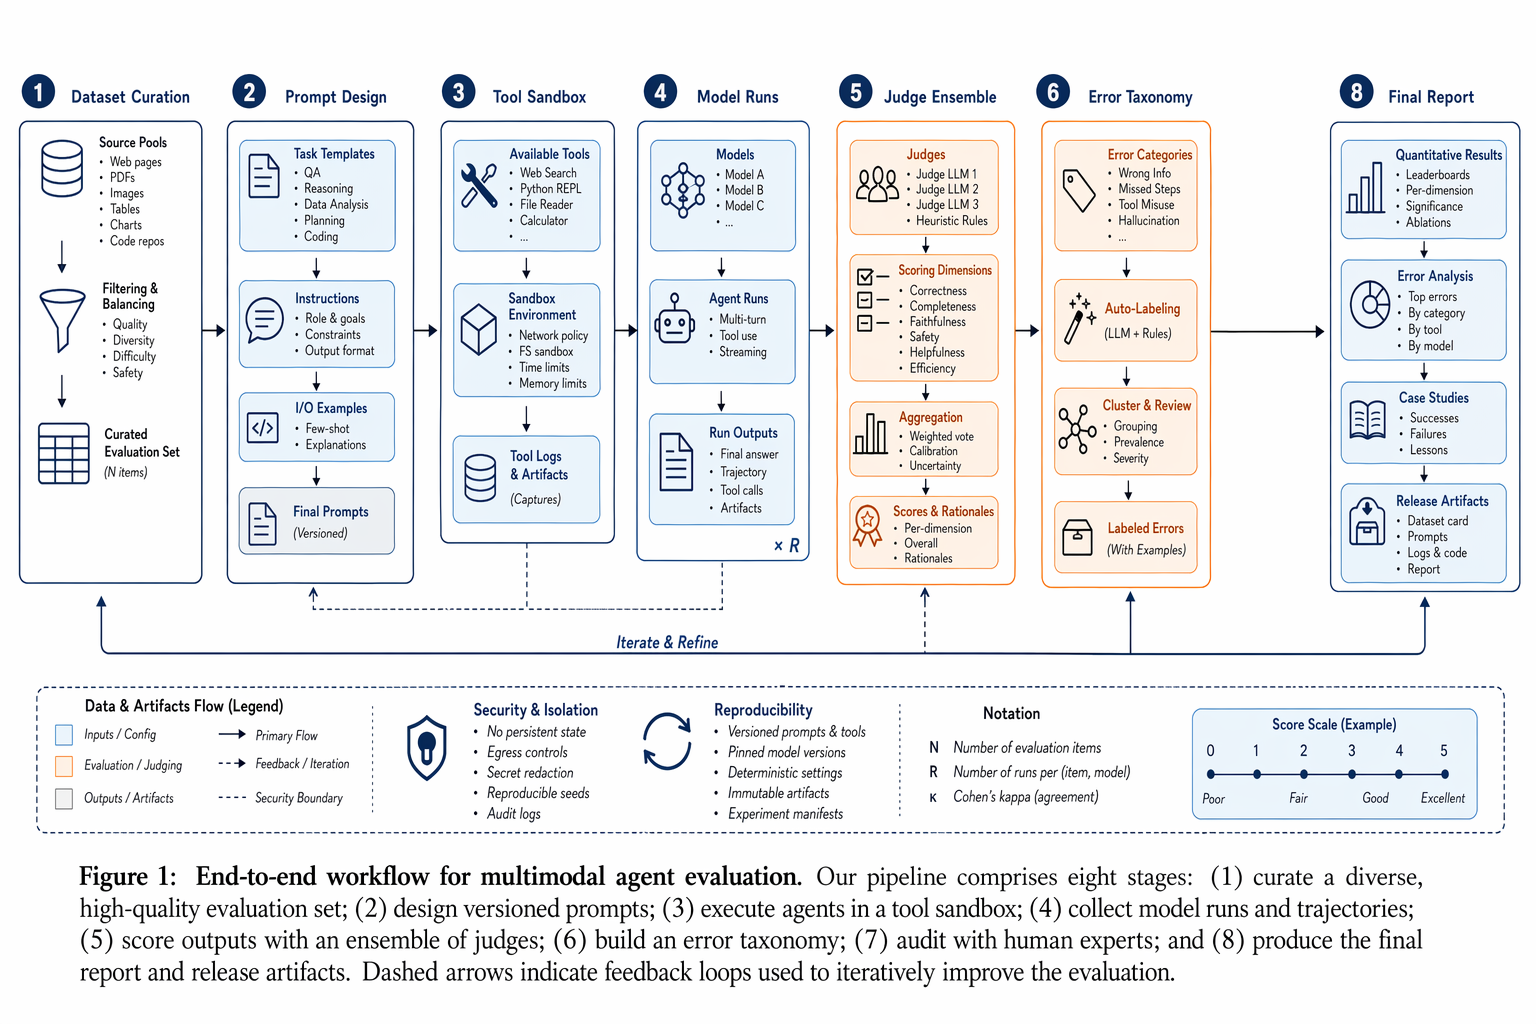
这幅由 ChatGPT 图像 2.0 生成的精美学术海报将最初的 GPT-1 论文重新构想为清爽的会议风格信息图。它将晦涩的研究转化为易于理解的动机、方法、结果和影响等章节,具备现代数据可视化的清晰度和可直接发表的设计水准。
- 分类
- 图表信息图
- 模型
- GPT Image 2
- 来源作者
- OpenAI
- 原始语言
- zh-CN
- 来源 ID
- 045
浏览量1
完整提示词
这幅由 ChatGPT 图像 2.0 生成的精美学术海报将最初的 GPT-1 论文重新构想为清爽的会议风格信息图。它将晦涩的研究转化为易于理解的动机、方法、结果和影响等章节,具备现代数据可视化的清晰度和可直接发表的设计水准。
多语言版本
Academic Poster
zh-CN这幅由 ChatGPT 图像 2.0 生成的精美学术海报将最初的 GPT-1 论文重新构想为清爽的会议风格信息图。它将晦涩的研究转化为易于理解的动机、方法、结果和影响等章节,具备现代数据可视化的清晰度和可直接发表的设计水准。