卫星异常界面模型
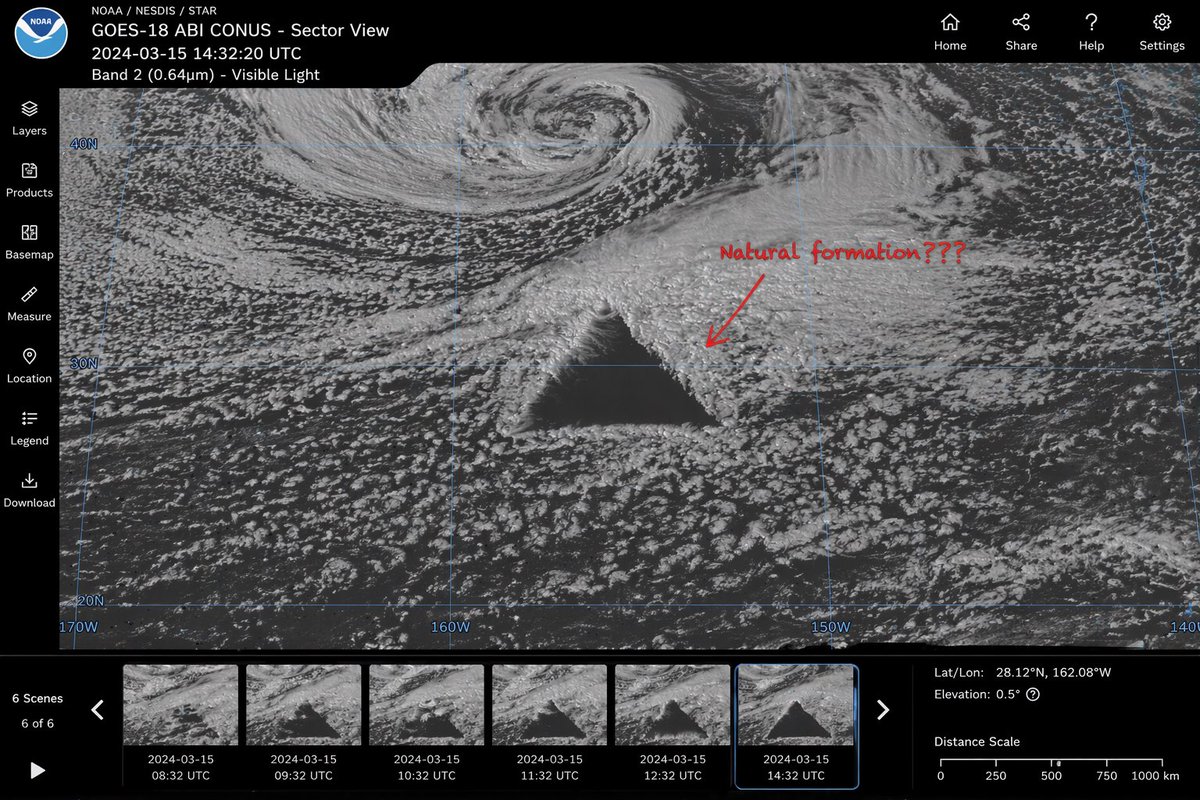
生成一个逼真的卫星图像网页界面,包含神秘的几何异常、时间轴缩略图和 UI 控件。
- 分类
- 图表信息图
- 模型
- GPT Image 2
- 来源作者
- Scott Muller
- 原始语言
- en
- 来源 ID
- 13762
- 发布时间
- 2026年4月16日
完整提示词
{
  "type": "卫星图像网页界面模型",
  "main_display": {
    "imagery": "海洋云层的灰度卫星视图,中心处包含一个 {argument name=\"anomaly shape\" default=\"巨大的、完美的几何深色三角形\"}",
    "annotation": "红色的手写文字“{argument name=\"annotation text\" default=\"自然形成???\"}”,并配有一个指向该异常的红色箭头",
    "overlay": "淡蓝色的经纬度网格线,带有 40N、30N、160W 等坐标标签"
  },
  "ui_layout": {
    "top_header": {
      "left_section": "NOAA 标志,文字“{argument name=\"satellite name\" default=\"GOES-18 ABI CONUS - Sector View\"}”、“{argument name=\"timestamp\" default=\"2024-03-15 14:32:20 UTC\"}”以及“Band 2 (0.64µm) - 可见光”",
      "right_section": "4 个导航图标,标签分别为:首页、分享、帮助、设置"
    },
    "left_sidebar": {
      "count": 7,
      "items": ["图层", "产品", "底图", "测量", "位置", "图例", "下载"]
    },
    "bottom_panel": {
      "timeline": {
        "controls": "播放按钮、左右箭头、文字“6 个场景”、“6 / 6”",
        "thumbnails": {
          "count": 6,
          "description": "展示异常演变过程的连续卫星图像,包含从 08:32 UTC 到 14:32 UTC 的每小时时间戳"
        }
      },
      "data_readout": {
        "coordinates": "{argument name=\"coordinate text\" default=\"经纬度:28.12°N, 162.08°W\"}",
        "elevation": "海拔:0.5°",
        "scale": "0 到 1000 km 的距离比例尺"
      }
    }
  }
}
多语言版本
卫星异常界面模型
en{ "type": "satellite imagery web interface mockup", "main_display": { "imagery": "greyscale satellite view of ocean clouds featuring a {argument name=\"anomaly shape\" default=\"massive, perfectly geometric dark triangle\"} in the center", "annotation": "red handwritten text '{argument name=\"annotation text\" default=\"Natural formation???\"}' with a red arrow pointing to the anomaly", "overlay": "faint blue latitude and longitude grid lines with coordinate labels like 40N, 30N, 160W" }, "ui_layout": { "top_header": { "left_section": "NOAA logo, text '{argument name=\"satellite name\" default=\"GOES-18 ABI CONUS - Sector View\"}', '{argument name=\"timestamp\" default=\"2024-03-15 14:32:20 UTC\"}', and 'Band 2 (0.64µm) - Visible Light'", "right_section": "4 navigation icons with labels: Home, Share, Help, Settings" }, "left_sidebar": { "count": 7, "items": ["Layers", "Products", "Basemap", "Measure", "Location", "Legend", "Download"] }, "bottom_panel": { "timeline": { "controls": "Play button, left/right arrows, text '6 Scenes', '6 of 6'", "thumbnails": { "count": 6, "description": "sequential satellite images showing the anomaly's progression, with hourly timestamps from 08:32 UTC to 14:32 UTC" } }, "data_readout": { "coordinates": "{argument name=\"coordinate text\" default=\"Lat/Lon: 28.12°N, 162.08°W\"}", "elevation": "Elevation: 0.5°", "scale": "Distance Scale bar from 0 to 1000 km" } } } }
卫星异常界面模型
zh-CN{ "type": "卫星图像网页界面模型", "main_display": { "imagery": "海洋云层的灰度卫星视图,中心处包含一个 {argument name=\"anomaly shape\" default=\"巨大的、完美的几何深色三角形\"}", "annotation": "红色的手写文字“{argument name=\"annotation text\" default=\"自然形成???\"}”,并配有一个指向该异常的红色箭头", "overlay": "淡蓝色的经纬度网格线,带有 40N、30N、160W 等坐标标签" }, "ui_layout": { "top_header": { "left_section": "NOAA 标志,文字“{argument name=\"satellite name\" default=\"GOES-18 ABI CONUS - Sector View\"}”、“{argument name=\"timestamp\" default=\"2024-03-15 14:32:20 UTC\"}”以及“Band 2 (0.64µm) - 可见光”", "right_section": "4 个导航图标,标签分别为:首页、分享、帮助、设置" }, "left_sidebar": { "count": 7, "items": ["图层", "产品", "底图", "测量", "位置", "图例", "下载"] }, "bottom_panel": { "timeline": { "controls": "播放按钮、左右箭头、文字“6 个场景”、“6 / 6”", "thumbnails": { "count": 6, "description": "展示异常演变过程的连续卫星图像,包含从 08:32 UTC 到 14:32 UTC 的每小时时间戳" } }, "data_readout": { "coordinates": "{argument name=\"coordinate text\" default=\"经纬度:28.12°N, 162.08°W\"}", "elevation": "海拔:0.5°", "scale": "0 到 1000 km 的距离比例尺" } } } }