返回提示词库
学术经济学图表模拟

示例图片

学术经济学图表模拟 1
图表信息图YouMindcharts-infographicsen

学术经济学图表模拟

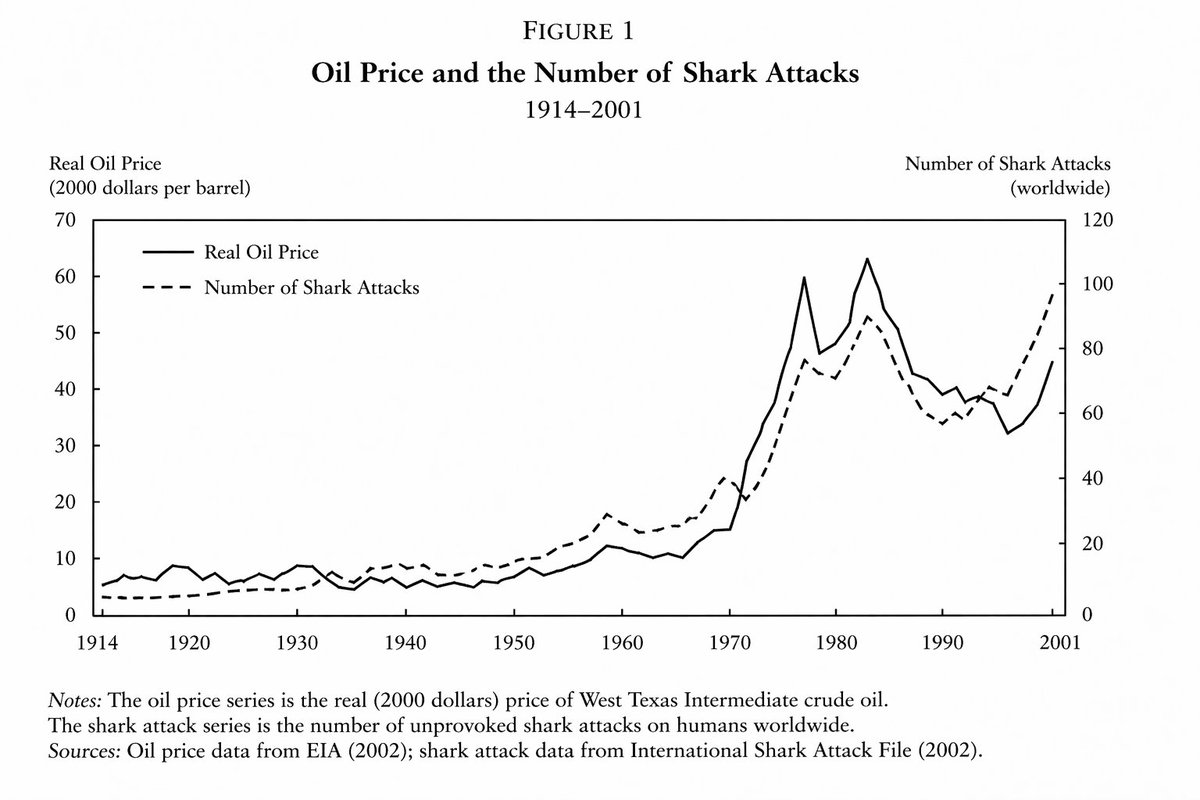
一个旨在生成高度逼真但虚构的学术图表的提示词,专门用于展示经济学论文风格中油价与鲨鱼袭击事件之间的相关性。

分类
图表信息图
模型
GPT Image 2
来源作者
QC
原始语言
en
浏览量0
来源 ID
14396
发布时间
2026年4月21日
在 Studio 中使用打开来源

完整提示词

来自一份重要且权威的 {argument name="field" default="经济学论文"} 的折线图,展示了 {argument name="time period" default="1914 年至 2001 年间"} {argument name="variable one" default="油价"} 与 {argument name="variable two" default="鲨鱼袭击次数"} 之间存在紧密但不完全一致的关系
多语言版本

学术经济学图表模拟

en

line graph from an important and prestigious {argument name="field" default="economics paper"} demonstrating a close but not exact relationship between {argument name="variable one" default="the price of oil"} and {argument name="variable two" default="the number of shark attacks"} between {argument name="time period" default="the years of 1914 and 2001"}

学术经济学图表模拟

zh-CN

来自一份重要且权威的 {argument name="field" default="经济学论文"} 的折线图,展示了 {argument name="time period" default="1914 年至 2001 年间"} {argument name="variable one" default="油价"} 与 {argument name="variable two" default="鲨鱼袭击次数"} 之间存在紧密但不完全一致的关系

提示词/图片相似

12

编辑级双轴数据信息图

编辑级双轴数据信息图

生成简洁的报纸风格双轴折线图,包含注释和标注框,非常适合对比呈现截然不同的数据趋势。

图表信息图YouMindcharts-infographics
GPT Image 20 浏览量
社论式双轴折线图信息图

社论式双轴折线图信息图

生成一种报纸风格的数据可视化图表,通过注释和双轴对比展示两种截然不同的趋势随时间的变化。

图表信息图YouMindcharts-infographics
GPT Image 21 浏览量
Small Multiples Climate Grid

Small Multiples Climate Grid

Produce a clean editorial data visualization poster showing a 4x3 small-multiples grid of monthly climate charts for 12 fictional cities. Use a white background, generous margins,

图表信息图wuyoscarGPT-Image2-Skill
GPT Image 21 浏览量
Empirical scaling laws plot

Empirical scaling laws plot

Landscape 16:9 log-scaled plot of training loss vs compute, four curves for different model sizes. X-axis "Training compute (FLOPs)" with log ticks "1e20", "1e21", "1e22", "1e23",

图表信息图wuyoscarGPT-Image2-Skill
GPT Image 20 浏览量
Patient cohort and multimodal biomarker workflow

Patient cohort and multimodal biomarker workflow

Create a Nature Medicine / Science Translational Medicine style research paper figure, landscape 3:2 (1536×1024), soft literature-science palette, minimal and elegant. Figure titl

图表信息图wuyoscarGPT-Image2-Skill
GPT Image 21 浏览量
Therapeutic response bar and forest plot

Therapeutic response bar and forest plot

Create a Nature Medicine style statistical results figure, landscape 3:2 (1536×1024), soft, restrained, publication-quality. Figure title: "Therapeutic response across molecular s

图表信息图wuyoscarGPT-Image2-Skill
GPT Image 21 浏览量
Academic Poster

Academic Poster

这幅由 ChatGPT 图像 2.0 生成的精美学术海报将最初的 GPT-1 论文重新构想为清爽的会议风格信息图。它将晦涩的研究转化为易于理解的动机、方法、结果和影响等章节,具备现代数据可视化的清晰度和可直接发表的设计水准。

图表信息图OpenAIcharts-infographics
GPT Image 21 浏览量
Desktop Operations Dashboard

Desktop Operations Dashboard

Create a high-end desktop SaaS analytics dashboard mockup for a fictional platform named HELIX OPS, displayed on a 16:10 monitor canvas at 1600x1000. Use a cool palette of slate, c

UI 与界面wuyoscarGPT-Image2-Skill
GPT Image 21 浏览量
物理考试题目布局

物理考试题目布局

一个旨在生成包含多道题目和答案的高中试卷图像的提示词。

海报营销YouMindposters-typography
GPT Image 20 浏览量
创意仪表盘 UI 截图

创意仪表盘 UI 截图

一个幽默的提示词,用于生成特定分析风格的数据仪表盘截图。

UI 与界面YouMindui-interfaces
GPT Image 21 浏览量
Ablation bar chart with error bars

Ablation bar chart with error bars

Landscape 16:9 grouped-bar ablation chart. X-axis: 5 benchmark groups "MMLU", "GSM8K", "HumanEval", "BBH", "MATH". Y-axis "Accuracy (%)" with ticks "0", "20", "40", "60", "80", "1

图表信息图wuyoscarGPT-Image2-Skill
GPT Image 21 浏览量
无限循环的提示词迷宫

无限循环的提示词迷宫

告诉他们你将要提示什么,然后提示他们,再告诉他们你刚刚提示了什么。

创意玩法OpenNanaNano Banana Pro
Nano Banana Pro55 浏览量